Difference between revisions of "Geo-Mapping Data using Google Charts"
(→Output) |
(→Output) |
||
| (12 intermediate revisions by the same user not shown) | |||
| Line 3: | Line 3: | ||
<bluebox> | <bluebox> | ||
| − | This is a series of (quick) steps taken to generate a geographical representation of a list of countries appearing in a CSV-formatted file (comma-separated values). The [https://developers.google.com/chart/ Google Charts] library is used to display the map. | + | This is a series of (quick) steps taken to generate a geographical representation of a list of countries appearing in a CSV-formatted file (comma-separated values). The [https://developers.google.com/chart/ Google Charts] library is used to display the map. The representation associates to each country the number of lines in the file that contain that country. For example, if the country "Belgium" appears 100 times in the CSV file, the value 100 will be associated with Belgium, and the darkness of the color used to show the country will be chosen to show the intensity of 100 compared to the most cited country. Some Python code is used to generate the HTML/Javascript code. |
</bluebox> | </bluebox> | ||
| + | <br /> | ||
| + | |||
| + | {| | ||
| + | | | ||
| + | __TOC__ | ||
| + | | | ||
| + | | ||
| + | | | ||
| + | [[Image:GoogleMap2.png|right|400px]] | ||
| + | |} | ||
=The Data= | =The Data= | ||
| Line 38: | Line 48: | ||
# See http://cs.smith.edu/dftwiki/index.php/Geo-Mapping_Data_using_Google_Charts#Python_to_the_Rescue.21 | # See http://cs.smith.edu/dftwiki/index.php/Geo-Mapping_Data_using_Google_Charts#Python_to_the_Rescue.21 | ||
# for more information. | # for more information. | ||
| + | # Written for Python 3.2. If using Python 2.X, removing the parentheses from the print statements should be | ||
| + | # all there is to do to make the code work. | ||
| + | # | ||
import codecs | import codecs | ||
| Line 319: | Line 332: | ||
</source> | </source> | ||
<br /> | <br /> | ||
| + | |||
=Output= | =Output= | ||
| − | Running the Python code will generate a file called '''EcomodAll.html''' in the current directory (where the Python code is saved). Clicking on this html file should open the browser and display a map of the world which will respond by opening up text box when the mouse hovers over a country for which we have a count. The example below is static (Mediawiki does not import Google maps without special plugins...) but you should have no trouble testing it out using the copy of the HTML page available [[HTML Geo-Map of the Ecomod Data| here]]. | + | Running the Python code will generate a file called '''EcomodAll.html''' in the current directory (where the Python code is saved). Clicking on this html file should open the browser and display a map of the world which will respond by opening up text box when the mouse hovers over a country for which we have a count. The example below is static (Mediawiki does not import Google maps without special plugins...) but you should have no trouble testing it out using the copy of the HTML page available [[HTML Geo-Map of the Ecomod Data| here]]. The color scheme is the default Google default scheme. |
| + | |||
| + | |||
| + | <br /> | ||
<br /> | <br /> | ||
| + | <center>[[Image:GoogleMap2.png|600px]]</center> | ||
<br /> | <br /> | ||
| − | <center>[[Image: | + | The same data with a different color scheme is shown below. It uses a gradient of 4 colors: |
| + | |||
| + | |||
| + | options['colors'] = ['0xedf0d4','0x6c9642','0x365e24','0x13390a']; | ||
| + | |||
| + | <center>[[Image:GoogleMap3.png|600px]]</center> | ||
| + | |||
<br /> | <br /> | ||
| + | ==Interactive Output== | ||
| + | An interactive version of the map above can be tested and found [http://cs.smith.edu/dftwiki/images/EcomodAll.html here]. | ||
<br /> | <br /> | ||
<br /> | <br /> | ||
Latest revision as of 12:16, 20 March 2013
--D. Thiebaut 12:02, 20 March 2013 (EDT)
This is a series of (quick) steps taken to generate a geographical representation of a list of countries appearing in a CSV-formatted file (comma-separated values). The Google Charts library is used to display the map. The representation associates to each country the number of lines in the file that contain that country. For example, if the country "Belgium" appears 100 times in the CSV file, the value 100 will be associated with Belgium, and the darkness of the color used to show the country will be chosen to show the intensity of 100 compared to the most cited country. Some Python code is used to generate the HTML/Javascript code.
|
|
The Data
The data generated was generously shared by Ecomod. It represents the dump of an eXcel spreadsheet in CSV format, and is shown in this page.
The Google Charts Library
Reference Pages
The Google Charts library has a special feature for generating maps. You should read Google's pages on this feature, and in particular the GeoMap page.
We will use the region option to display our data. Markers would have been a nice alternative, showing cities rather than countries, but as Google restricts the number of data points to 400 maximum per chart, and we have more than 400 entries in our CSV file, the region option is better suited here.
Debugging
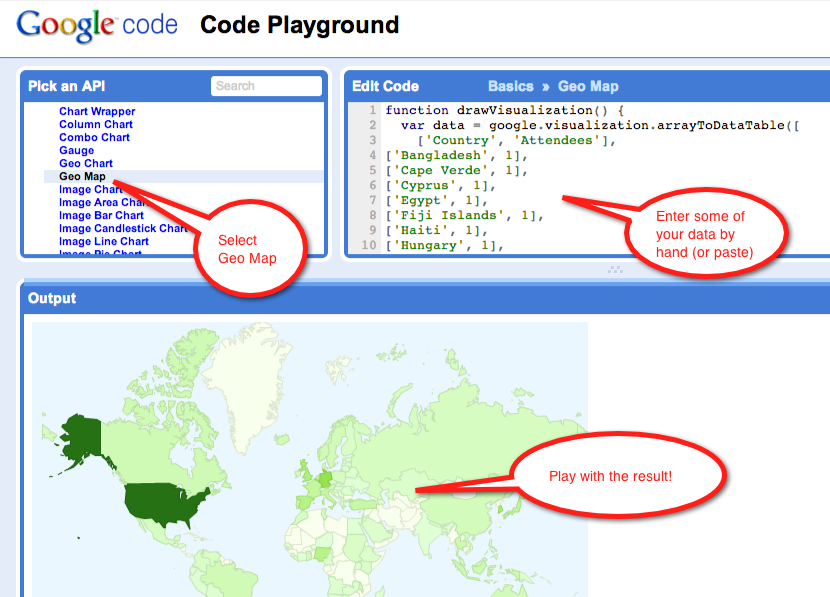
Google provides a nice page to debug your code before putting it together in a Web page. The page is at https://code.google.com/apis/ajax/playground/?type=visualization#geo_map. We use it to troubleshoot our format and country entries. (Using this page allowed us to discover that some of the country names were not formatted correctly, containing quotes, for example, which broke the Javascript strings.
Make sure you play with this page to tune your output. This goes for colors and size as well.

Python to the Rescue!
Here's why Python is great: it takes very little time and effort to write a Python program to take the CSV and shape it into the form we want, and write the resulting HTML code to file.
The documented code is shown below. It is pretty much a linear piece of code without functions that filters the CSV and generates the HTML string we need.
# Process Ecomod Data
# D. Thiebaut
# See http://cs.smith.edu/dftwiki/index.php/Geo-Mapping_Data_using_Google_Charts#Python_to_the_Rescue.21
# for more information.
# Written for Python 3.2.  If using Python 2.X, removing the parentheses from the print statements should be
# all there is to do to make the code work.
#

import codecs
import sys

# read the csv file into a string
csvAll = open( "EcomodReduced.csv", "r", encoding="utf-8" ).read( )


# Code taken from the Google chart page
# The html string contains the html code taken from Google's chart page
# https://developers.google.com/chart/interactive/docs/gallery/geomap
# Note the two %s entries.  The first one will be where we will insert
# the list of countries and associated counts.  The second %s is where
# we will insert a table listing all the countries.  This part is not
# on the original Google example, but added as a bonus.
# format for the first %s in html should be of the form:
#        ['Country',   'count'],
#        ['United States',   155],
#        ['Germany',     66],
#        etc.

html="""
<html>
<head>
  <script type='text/javascript' src='https://www.google.com/jsapi'></script>
  <script type='text/javascript'>
   google.load('visualization', '1', {'packages': ['geomap']});
   google.setOnLoadCallback(drawMap);

    function drawMap() {
      var data = google.visualization.arrayToDataTable([
        %s  <!-- that's where the data is inserted -->
      ]);

      var options = {};
      options['dataMode'] = 'regions';
      options['width'] = '1112';
      options['height' ] = '694';
      var container = document.getElementById('map_canvas');
      var geomap = new google.visualization.GeoMap(container);
      geomap.draw(data, options);
  };
  </script>
  <title>Ecomod Conferences</title>
</head>

<body>
  <h1>Ecomod Conferences: All Attendees</h1>
  <div id='map_canvas'></div>
  <br />
  %s  <!-- that's where the table is inserted -->
</body>

</html>

"""

# The list of countries below was generated by running through
# the CSV file once and putting all the countries in a set, and
# then the set was put in a list, sorted and printed out.  The
# typos and mistakes were then fixed by hand, and the result pasted
# below.

COUNTRIES="""Angola
Argentina
Armenia
Australia
Austria
Azerbaijan
Bahrain
Bangladesh
Barbados
Belarus
Belgium
Bolivia
Botswana
Brazil
Brunei
Cameroon
Canada
Cape Verde
Chile
China
Colombia
Cote d'Ivoire
Croatia
Cyprus
Czech Republic
Denmark
Ecuador
Egypt
Estonia
Ethiopia
Ethopia
Fiji Islands
Finland
France
Germany
Ghana
Greece
Guadeloupe
Guatemala
Haiti
Hawaii
Honduras
Hong Kong
Hungary
Iceland
India
Indonesia
Ireland
Israel
Italy
Ivory Coast
Jamaica
Japan
Jordan
Kazakhstan
Kenya
Korea
Kuwait
Lao People's Democratic Republic
Latvia
Lebanon
Lesotho
Liberia
Lithuania
Luxembourg
Macedonia
Madagascar
Madrid
Malawi
Malaysia
Malta
Mauritius
Mauritus
Mexico
Moldova
Morocco
Namibia
Nepal
Netherlands
New Zealand
Niger
Nigeria
Northern Cyprus
Norway
Papua New Guinea
Peru
Philippines
Poland
Portugal
Romania
Russia
Saudi Arabia
Senegal
Serbia
Sierra Leone
Singapore
Slovak Republic
Slovakia
Slovenia
South Africa
South Korea
Spain
Sri Lanka
Sudan
Swaziland
Sweden
Switzerland
Syrian Arab Republic
Taiwan
Thailand
The Gambia
Togo
Trinidad and Tobago
Tunisia
Turkey
Uganda
Ukraine
United Arab Emirates
United Kingdom
United States
Venezuela
Vietnam
Zambia"""


# create data structures to hold the various entries
acceptedCountries = set( COUNTRIES.split( "\n" ) )
locations = []
countryCounts = {}
countries = set([])


# split the collection of CSV lines into single lines
# and each line into fields (called parts).
for line in csvAll.split( "\n" ):
    parts = line.split( "," )

    # skip lines that are too short
    if len( parts ) < 5:
        continue

    # keep only the city and country information, starting by the end
    city = parts[-4].strip()
    country = parts[-3].strip()

    # correct misspelling & typos that were spotted in the input
    if ( city.find( "DC" )!= -1 ): city = "Washington, DC"
    if ( country == "USA" ): country = "United States"
    # Google does not accept "United States of America", keep 1st 2 words
    if ( country.find("United States") != -1 ): country = "United States"
    if ( city.find( "NY" )!= -1 ): city = "New York, NY"
    if ( country.find( "Kindgom" )!= -1): country = "United Kingdom"

    # skip unrecognized countries, including misplaced zip-codes
    if country not in acceptedCountries: continue
    if country.isdigit(): continue

    #--- at this point we have good data. ---

    # add country to set of countries (eliminates duplicates)
    countries.add( country )

    # count frequency of occurence for each country
    try:
        countryCounts[ country ] += 1
    except:
        countryCounts[ country ] = 1
    locations.append( ( city, country) )


# uncomment the code below to generate the list of unique
# countries (which is pasted in the varialbe COUNTRIES above.
"""
countries = list( countries )
countries.sort()
for country in countries:
    print( country )

for town, country in locations:
    print( town + ", " + country )

sys.exit( 0 )
"""


# now that the data structures are created, go through them and
# generate the strings needed in the HTML output.

# create the list of countries with their frequency next
list = []
for country in countryCounts.keys():
    count = countryCounts[ country ]
    list.append( (count, country ) )

list.sort()
list.reverse()

# put the list into a string
# at the same time create the html table
htmlString = "['Country', 'Attendees']"
tableString = """<table border="1"><tr><th>Country</th><th>Number of attendees</th></tr>\n"""

for count, country in list:
    #print( "%d, %s" % (count, country ) )
    htmlString += ",\n['%s', %d]" % ( country.replace( "'", "\\'"), count )
    tableString+= "<tr><td>%s</td><td>%d</td></tr>\n" % ( country, count )

# close the two strings
htmlString += "\n"
tableString+= "</table>\n"

# save the resulting html to file.
#print( html %  (htmlString, tableString) )
open( "EcomodAll.html", "w" ).write( html % ( htmlString, tableString ) )
Output
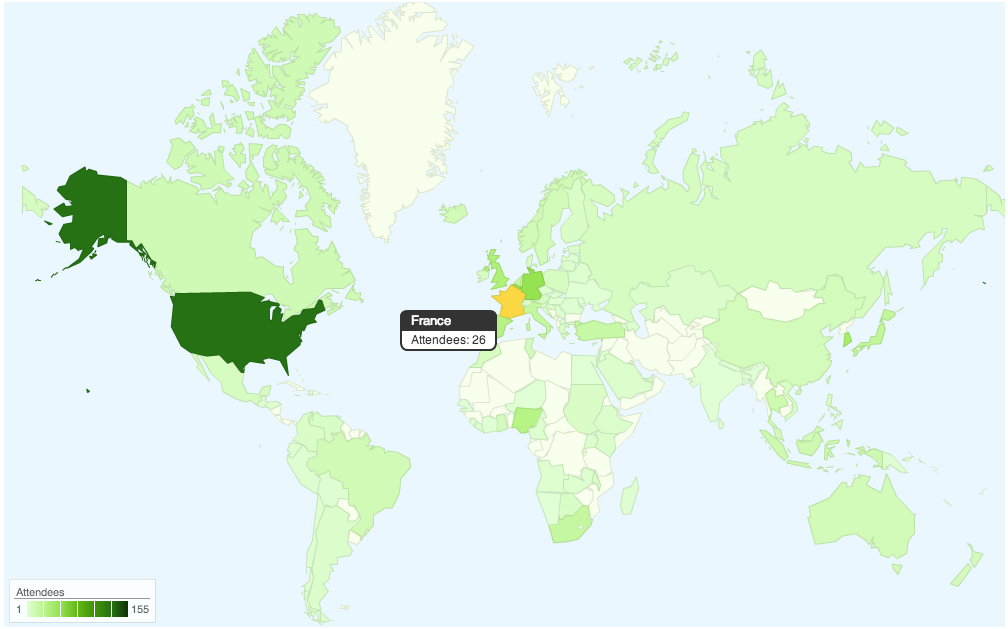
Running the Python code will generate a file called EcomodAll.html in the current directory (where the Python code is saved). Clicking on this html file should open the browser and display a map of the world which will respond by opening up text box when the mouse hovers over a country for which we have a count. The example below is static (Mediawiki does not import Google maps without special plugins...) but you should have no trouble testing it out using the copy of the HTML page available here. The color scheme is the default Google default scheme.

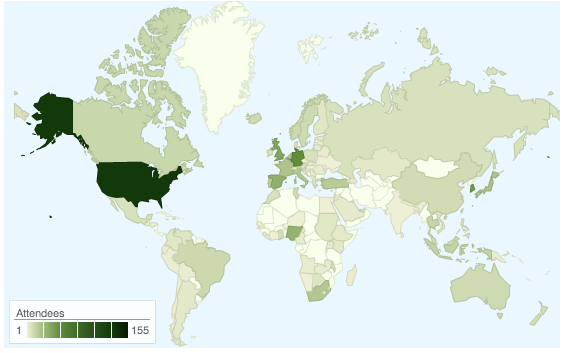
The same data with a different color scheme is shown below. It uses a gradient of 4 colors:
options['colors'] = ['0xedf0d4','0x6c9642','0x365e24','0x13390a'];

Interactive Output
An interactive version of the map above can be tested and found here.