Difference between revisions of "Tutorial: Profiling Java Programs"
(→Starting Monitoring the Processing/Java Application) |
(→The Packing Application) |
||
| (12 intermediate revisions by the same user not shown) | |||
| Line 14: | Line 14: | ||
=VisualVM= | =VisualVM= | ||
<br /> | <br /> | ||
| − | * On some | + | * On some systems '''Java VisualVM''' is already part of the installed software, so test first if you have it. It is sometimes in the Applications folder under '''Java VisualVM''', or sometimes it starts in the Terminal with the command '''jvisualvm''' or simply '''visualvm'''. |
| − | * VisualVM can be downloaded from [http://visualvm.java.net/download.html visualvm.java.net]. Once you have downloaded and installed it, you should be ready | + | * VisualVM can be downloaded from [http://visualvm.java.net/download.html visualvm.java.net]. Once you have downloaded and installed it, you should be ready to run this application. |
| − | * The documentation for VisualVM is available [http://visualvm.java.net/docindex.html here]. | + | * The documentation for VisualVM is available [http://visualvm.java.net/docindex.html here], as well as on the [http://docs.oracle.com/javase/7/docs/technotes/guides/visualvm/ Oracle] Website. |
<onlysmith> | <onlysmith> | ||
* The project, as a tar-zipped archive is available [http://cs.smith.edu/dftwiki/images/352_PackingVisualVMTutorial.tgz here]. | * The project, as a tar-zipped archive is available [http://cs.smith.edu/dftwiki/images/352_PackingVisualVMTutorial.tgz here]. | ||
</onlysmith> | </onlysmith> | ||
| − | + | <br /> | |
=The Packing Application= | =The Packing Application= | ||
| − | * The packing application we are going to use for this tutorial is a Processing application. The YouTube movie below illustrates how it proceeds | + | <br /> |
| − | * Setup the packing application either as an Eclipse project, or using the Processing IDE. If you are using Eclipse, do not forget to include the '''core.jar''' as an external library in your '''Build Path'''. | + | <center><videoflash>dqiwyD5LSz8</videoflash> |
| − | * Run the application | + | <br /> |
| − | The second reason is that there is potentially some bottleneck in the program. VisualVM should allow us to look at different aspects of the program. | + | * The packing application we are going to use for this tutorial is a Processing application. The YouTube movie below illustrates how it proceeds packing 20,000 randomly sized rectangles into a larger rectangle. |
| + | * Setup the packing application either as an '''Eclipse''' project, or using the '''Processing IDE'''. If you are using Eclipse, do not forget to include the '''core.jar''' in your project and add it as an external library in your '''Build Path'''. | ||
| + | * Run the application and observe that the application starts quite fast, but slows down significantly as it has packed roughly three quarters of the original empty surface. One factor for the slowdown is the fact that the list containing the random rectangles is sorted by decreasing area, and the algorithm picks the largest first, and the smallest last. Hence, as the algorithm progresses with the packing from left to right, it packs on smaller and smaller rectangles and the frontier defining the edge between packed and unpacked areas advances more and more slowly. The second reason is that there is potentially some bottleneck in the program. VisualVM should allow us to look at different aspects of the program. | ||
| + | <br /> | ||
=Starting Monitoring the Processing/Java Application= | =Starting Monitoring the Processing/Java Application= | ||
| + | <br /> | ||
* First start Java Visual VM. | * First start Java Visual VM. | ||
<br /> | <br /> | ||
<center>[[Image:JavaVisualVM1.jpg|600px]]</center> | <center>[[Image:JavaVisualVM1.jpg|600px]]</center> | ||
<br /> | <br /> | ||
| − | * Start | + | * Start the packing application. In this tutorial we are starting it from Eclipse. As soon as the applet opens and fills up with purple rectangles, a new entry appears in the Java VisualVM window: '''Applet Viewer (pid 44478)''' |
<br /> | <br /> | ||
<center>[[Image:JavaVisualVM2.jpg|600px]]</center> | <center>[[Image:JavaVisualVM2.jpg|600px]]</center> | ||
<br /> | <br /> | ||
| − | * Click on the | + | * Click on the '''Applet Viewer''' line, and in the right panel click on '''Monitor''': |
<br /> | <br /> | ||
<center>[[Image:JavaVisualVM3.jpg|600px]]</center> | <center>[[Image:JavaVisualVM3.jpg|600px]]</center> | ||
<br /> | <br /> | ||
| − | *The monitor window | + | *The monitor window opens and displays 4 different charts |
;CPU (1) | ;CPU (1) | ||
| − | : The CPU chart incates the CPU usage. The documentation is not clear as to what this means on multicore machines. But in the figure above the 30% or so usage seems to indicate the utilization on 1 core. The blue line that overlaps the x-axis is the ''Garbage Collector'', or | + | : The CPU chart incates the CPU usage. The documentation is not clear as to what this means on multicore machines. But in the figure above the 30% or so usage seems to indicate the utilization on 1 core. The blue line that overlaps the x-axis is the ''Garbage Collector'', or GC for short. If this line ever grows above the x-axis, it will indicate that your application is creating a large quantity of objects that it leaves behind, and the GC is busy cleaning up after the application. |
;Heap (2) | ;Heap (2) | ||
| − | The Heap graph shows the amount of heap (memory available for dynamic objects) available (in orange) and used up (in blue). If the blue line is very close to the orange one, your application is filling up the heap with objects. You may have a leak in your program. | + | The Heap graph shows the amount of heap (memory available for dynamic objects) available (in orange) and used up (in blue). If the blue line is very close to the orange one, your application is filling up the heap with objects. You may have a ''leak'' in your program (see below). |
;Classes (3) | ;Classes (3) | ||
| − | :This is the number of different loaded classes your application uses. You may think that your application is using much fewer classes, but actually all the libraries and imported classes you | + | :This is the number of different loaded classes your application uses. You may think that your application is using much fewer classes, but actually all the libraries and imported classes you define in your program contribute to about 2,000 definitions. The number of objects created by your application, however, can easily range in the millions. |
;Threads (4) | ;Threads (4) | ||
| − | That's the number of all threads running while your application runs. The packing application has only 3 threads: the main application, the GUI thread, and the packing thread. However, | + | That's the number of all threads running while your application runs. The packing application has only 3 threads: the main application, the GUI thread, and the packing thread. However, the profiler shows that close to 20 live threads are running while the application is on-going. |
| − | [http://stackoverflow.com/questions/7698861/simple-java-example-runs-with-14-threads-why StackOverflow has interesting answers] to the question a programmer asked about " | + | [http://stackoverflow.com/questions/7698861/simple-java-example-runs-with-14-threads-why StackOverflow has interesting answers] to the question a programmer asked about the reason for "so many threads!?" |
| + | <br /> | ||
| + | =Viewing Threads= | ||
| + | <br /> | ||
| + | * the '''Thread''' tab shows the different threads ''running'', ''waiting'', or ''terminated''. You can easily spot the Main Application Thread and the GUI thread. Our packing thread is harder to spot. But it should be green, as it is running all the time... | ||
| + | <br /> | ||
| + | <center>[[Image:JavaVisualVM4.jpg|600px]]</center> | ||
| + | <br /> | ||
| + | <center>[[Image:JavaVisualVM5.jpg|600px]]</center> | ||
| + | <br /> | ||
| + | =Sampling the Application= | ||
<br /> | <br /> | ||
| − | = | + | The '''Sampler''' tab offers a lot of very useful information. What the Java Visual VM application does is to regularly samples our Java/Processing application and examine a lot of information associated with the different threads (running or not). This generates valuable information about the amount of time the CPU spends in different methods, and also yields some idea of the number of various objects present in the heap. |
| − | + | <br /> | |
| + | ==CPU== | ||
| + | <br /> | ||
| + | When you click the '''CPU''' button, you get a list of methods and the amount of time the CPU (or CPUs) are spending in these methods, by default sorted from most CPU-time consuming to least CPU-time consuming. | ||
| + | <br /> | ||
| + | <center>[[Image:JavaVisualVM6.jpg|600px]]</center> | ||
| + | <br /> | ||
| + | In the image above we see that our application is spending 31% of the processor time in the '''get()''' method of the '''RedBlackTree''' class, followed very closely by the '''getLessThanOrEqual()''' method of the same class.. '''Keys()''' is not far behind with 25% of the time used. So definitely these three methods account for roughly 85% of the time spent by the CPU on the packing algorithm. | ||
| + | If we were interested in speeding up the application, these would be the three we should look at first. | ||
| + | <br /> | ||
| + | ==Memory== | ||
| + | <br /> | ||
| + | When you click on the '''Memory''' button, you get a list of the objects or data-structures that occupy the most amount of space in the heap. | ||
| + | <br /> | ||
| + | <center>[[Image:JavaVisualVM7.jpg|600px]]</center> | ||
| + | <br /> | ||
| + | The image above shows that '''Node''' objects of the '''RedBlackTree''' class account for 22% of the memory space. Look at the number of objects, though: 602,343, taking a total of 24 MBytes. If we were to analyze the program closer we would find that the nodes actually hold ''segments'' that define band of free packing space, or ''rectangles''. If we further look at the packing algorithm, we would notice that whenever a new rectangle is added, it generates only a handful of segments. Since we are packing 20,000 rectangles, the number of segments should be in the 100,000 range, but not 600 thousand. The reason we have so many is that some of these segments are actually dead, deleted objects, that haven't been caught up by the ''Garbage Collector'' (GC) yet. | ||
| + | <br /> | ||
| + | ===Memory Leak=== | ||
| + | <br /> | ||
| + | This leads us to the concept of ''memory leak''. A memory leak occurs in an application when this application, while running, slowly fills up the heap with objects that are not officially deleted by the program. If an object that is not used by the program is not deleted, then it remains in memory and the GC cannot reclaim its space. It is as if the application is leaking objects in the heap, hence the name we give to this condition. If the number of bytes and number of instances in your application were to increase constantly and significantly in your program to the point of using up all the space, this could be an indication of a memory leak. | ||
| + | <br /> | ||
| + | =Profiler= | ||
| + | <br /> | ||
| + | The difference between '''Sampling''' and '''Profiling''' is provided by User ''npe'' on [http://stackoverflow.com/questions/12130107/difference-between-sampling-and-profiling-in-jvisualvm Slashdot] (captured on 9/30/13): | ||
| + | |||
| + | ::::''Sampling'' means taking many thread dumps and analyzing stack traces. This is usually faster, does not require runtime changes in your bytecode (which may break it), but is also less accurate. | ||
| + | |||
| + | ::::''Profiling'' means instrumenting your classes and methods, so they "report" whenever they are run. This is more accurate, as it counts every invocation of instrumented method, not only those caught when the dump is done. However instrumentation means that the bytecode of your classes is changed, and this may break your program. Actually, for that reason, using profiling on large application servers (like JBoss, or WebLogic) often causes everything to die or hang. | ||
| + | |||
| + | Nicely said. The sampling is fast and does not modify the code, and therefore affects the application less. Profiling requires changing the code, and if you are after a particular bug or bad behavior, sometimes the action of profiling will hide the problem you're trying to recreate and uncover. | ||
| + | |||
| + | The figure below shows the result of profiling our packing application. Notice that the information displayed is quite different from what the sampler was showing. | ||
| + | <br /> | ||
| + | <br /> | ||
| + | <center>[[Image:JavaVisualVM8.jpg|600px]]</center> | ||
| + | <br /> | ||
| + | <br /> | ||
| + | {| style="width:100%; background:silver" | ||
| + | |- | ||
| + | | | ||
| + | |||
| + | == Exercise == | ||
| + | |} | ||
| + | [[Image:QuestionMark3.jpg|right|120px]] | ||
| + | * Look at the code for the three methods that seem to consume the most CPU and propose ways to reduce their execution time. | ||
| + | <br /> | ||
| + | <br /> | ||
| + | <br /> | ||
| + | <br /> | ||
| + | <br /> | ||
| + | <br /> | ||
| + | <br /> | ||
| + | <br /> | ||
| + | <br /> | ||
| + | <br /> | ||
| + | <center>[[Image:Packing20KRectsOnXgridmac.png|700px]] | ||
| + | <br />20,000 rectangles packed. | ||
| + | </center><br /> | ||
| + | |||
<br /> | <br /> | ||
<br /> | <br /> | ||
| Line 65: | Line 138: | ||
<br /> | <br /> | ||
<br /> | <br /> | ||
| − | [[Category:Java]][[category:tutorials]] | + | [[Category:Java]][[category:tutorials]][[category:Processing]][[category:Eclipse]] |
Latest revision as of 19:20, 30 September 2013
--D. Thiebaut (talk) 15:01, 30 September 2013 (EDT)
This tutorial is intended to give a brief overview of JVisualVM, the profiler for Java. We use this profiler with Eclipse and use a 2D-packing application as our target application. Our goal is to figure out where the program is spending most of its time. The environment used to create this tutorial is VisualVM 1.3.6 running on OS X 10.7.5, and the hardware is a 2.8 GHz dual quad-core MacPro.
Contents
VisualVM
- On some systems Java VisualVM is already part of the installed software, so test first if you have it. It is sometimes in the Applications folder under Java VisualVM, or sometimes it starts in the Terminal with the command jvisualvm or simply visualvm.
- VisualVM can be downloaded from visualvm.java.net. Once you have downloaded and installed it, you should be ready to run this application.
- The documentation for VisualVM is available here, as well as on the Oracle Website.
The Packing Application
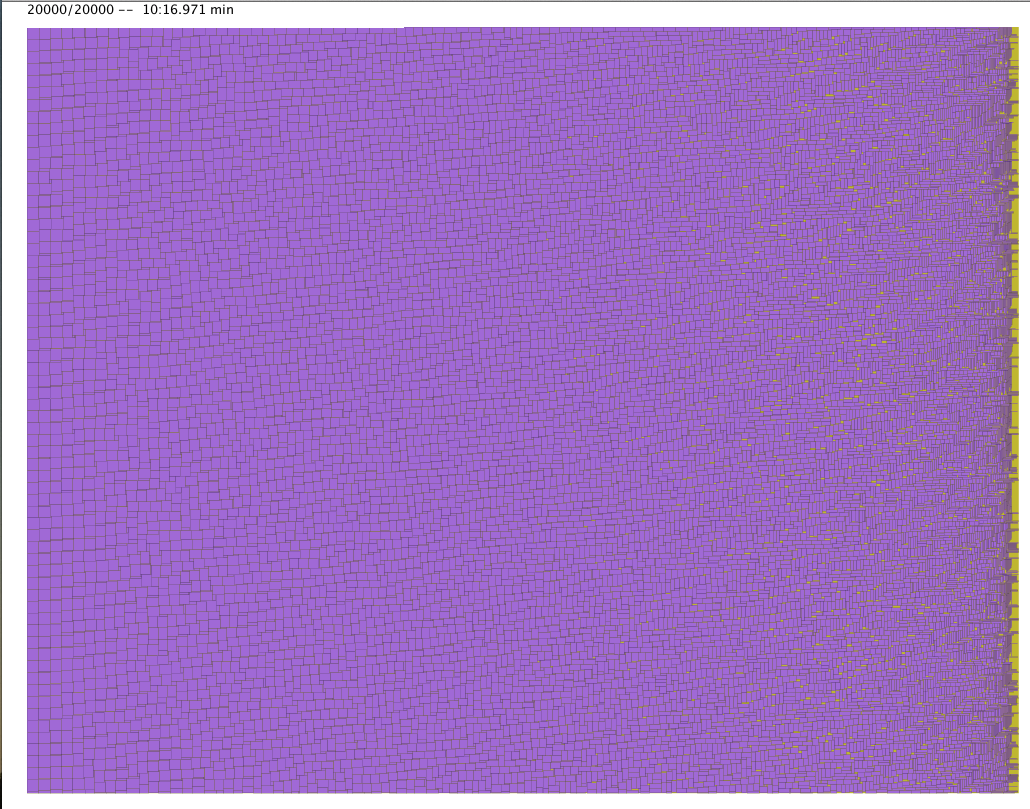
- The packing application we are going to use for this tutorial is a Processing application. The YouTube movie below illustrates how it proceeds packing 20,000 randomly sized rectangles into a larger rectangle.
- Setup the packing application either as an Eclipse project, or using the Processing IDE. If you are using Eclipse, do not forget to include the core.jar in your project and add it as an external library in your Build Path.
- Run the application and observe that the application starts quite fast, but slows down significantly as it has packed roughly three quarters of the original empty surface. One factor for the slowdown is the fact that the list containing the random rectangles is sorted by decreasing area, and the algorithm picks the largest first, and the smallest last. Hence, as the algorithm progresses with the packing from left to right, it packs on smaller and smaller rectangles and the frontier defining the edge between packed and unpacked areas advances more and more slowly. The second reason is that there is potentially some bottleneck in the program. VisualVM should allow us to look at different aspects of the program.
Starting Monitoring the Processing/Java Application
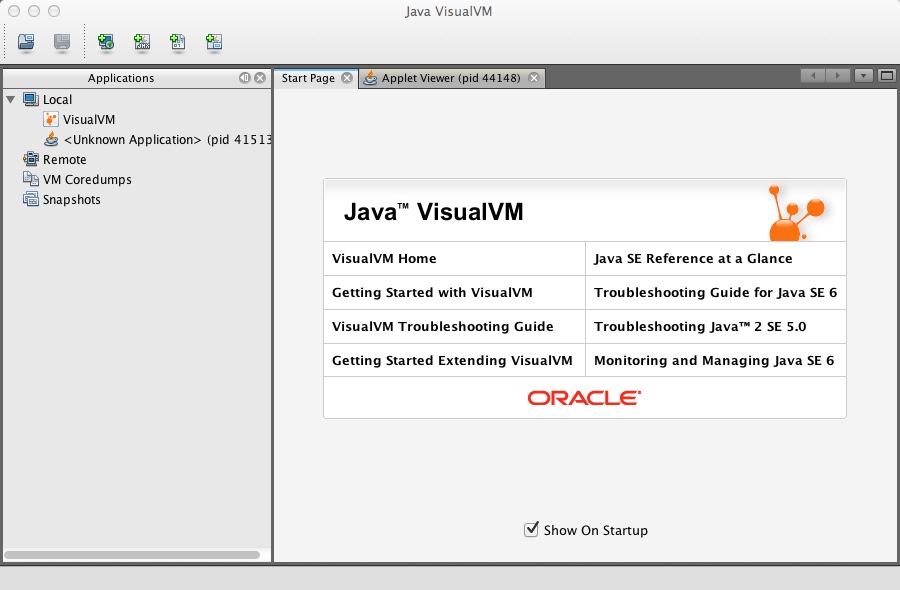
- First start Java Visual VM.
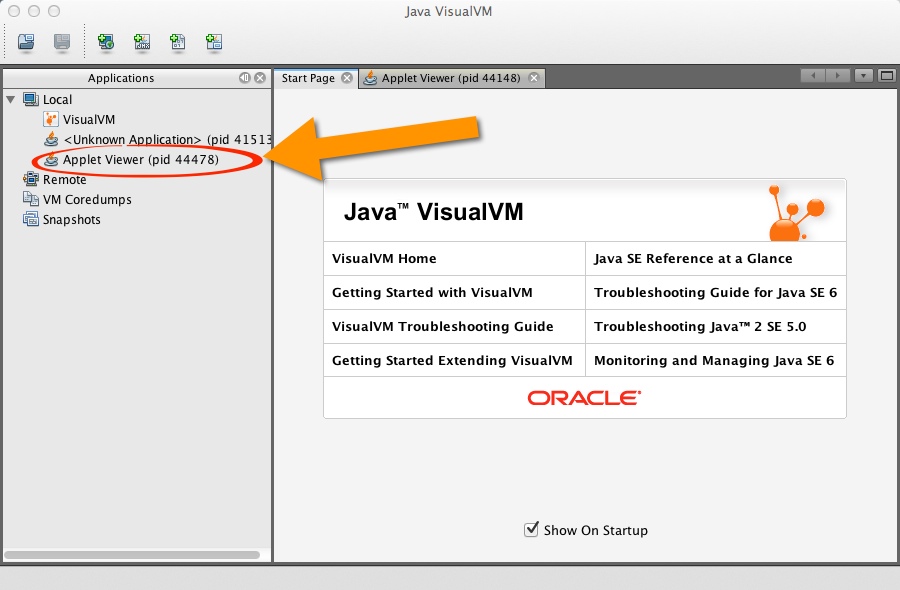
- Start the packing application. In this tutorial we are starting it from Eclipse. As soon as the applet opens and fills up with purple rectangles, a new entry appears in the Java VisualVM window: Applet Viewer (pid 44478)
- Click on the Applet Viewer line, and in the right panel click on Monitor:
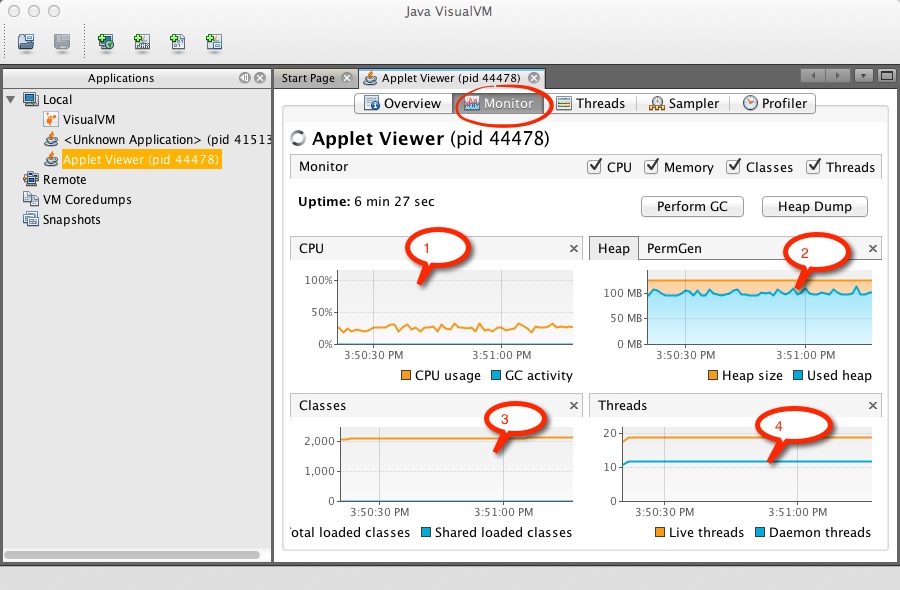
- The monitor window opens and displays 4 different charts
- CPU (1)
- The CPU chart incates the CPU usage. The documentation is not clear as to what this means on multicore machines. But in the figure above the 30% or so usage seems to indicate the utilization on 1 core. The blue line that overlaps the x-axis is the Garbage Collector, or GC for short. If this line ever grows above the x-axis, it will indicate that your application is creating a large quantity of objects that it leaves behind, and the GC is busy cleaning up after the application.
- Heap (2)
The Heap graph shows the amount of heap (memory available for dynamic objects) available (in orange) and used up (in blue). If the blue line is very close to the orange one, your application is filling up the heap with objects. You may have a leak in your program (see below).
- Classes (3)
- This is the number of different loaded classes your application uses. You may think that your application is using much fewer classes, but actually all the libraries and imported classes you define in your program contribute to about 2,000 definitions. The number of objects created by your application, however, can easily range in the millions.
- Threads (4)
That's the number of all threads running while your application runs. The packing application has only 3 threads: the main application, the GUI thread, and the packing thread. However, the profiler shows that close to 20 live threads are running while the application is on-going.
StackOverflow has interesting answers to the question a programmer asked about the reason for "so many threads!?"
Viewing Threads
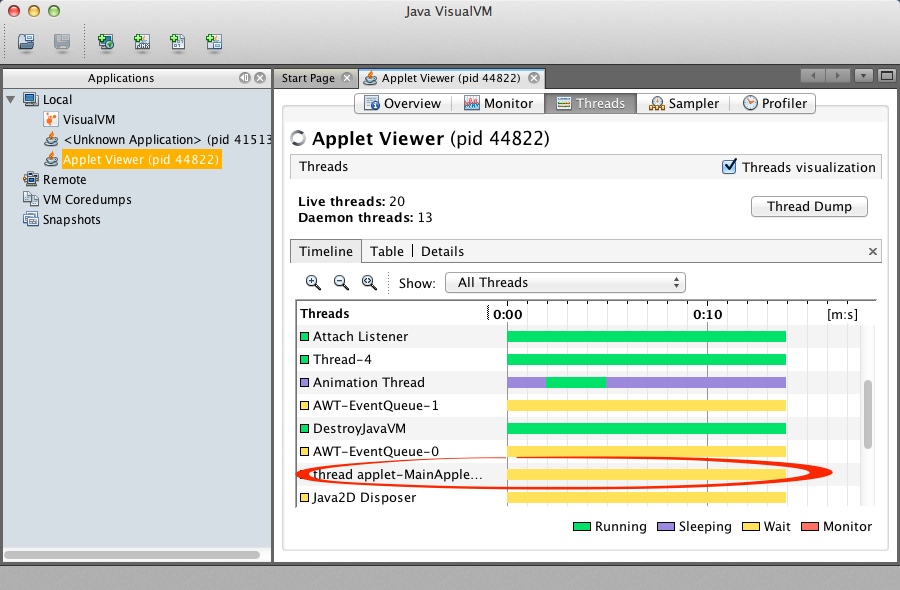
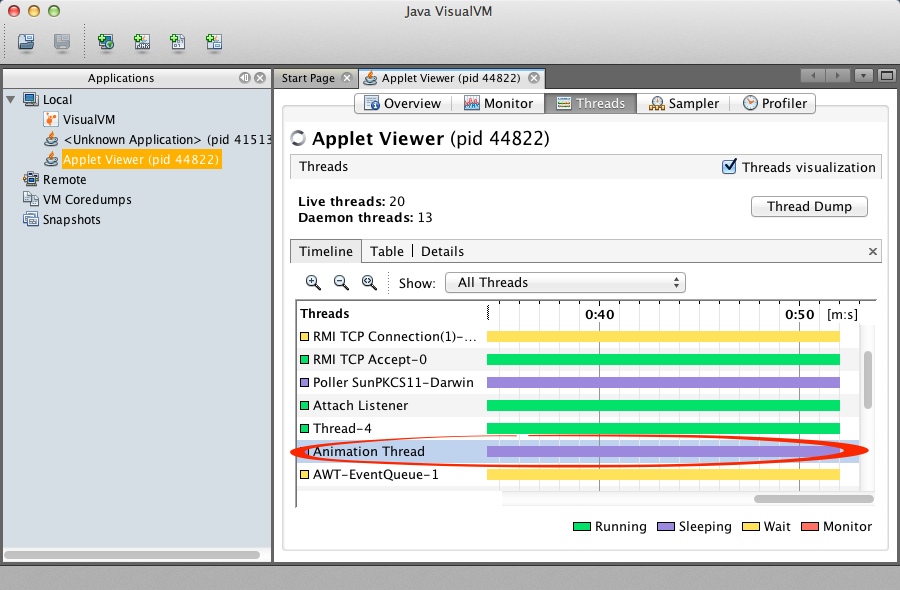
- the Thread tab shows the different threads running, waiting, or terminated. You can easily spot the Main Application Thread and the GUI thread. Our packing thread is harder to spot. But it should be green, as it is running all the time...
Sampling the Application
The Sampler tab offers a lot of very useful information. What the Java Visual VM application does is to regularly samples our Java/Processing application and examine a lot of information associated with the different threads (running or not). This generates valuable information about the amount of time the CPU spends in different methods, and also yields some idea of the number of various objects present in the heap.
CPU
When you click the CPU button, you get a list of methods and the amount of time the CPU (or CPUs) are spending in these methods, by default sorted from most CPU-time consuming to least CPU-time consuming.
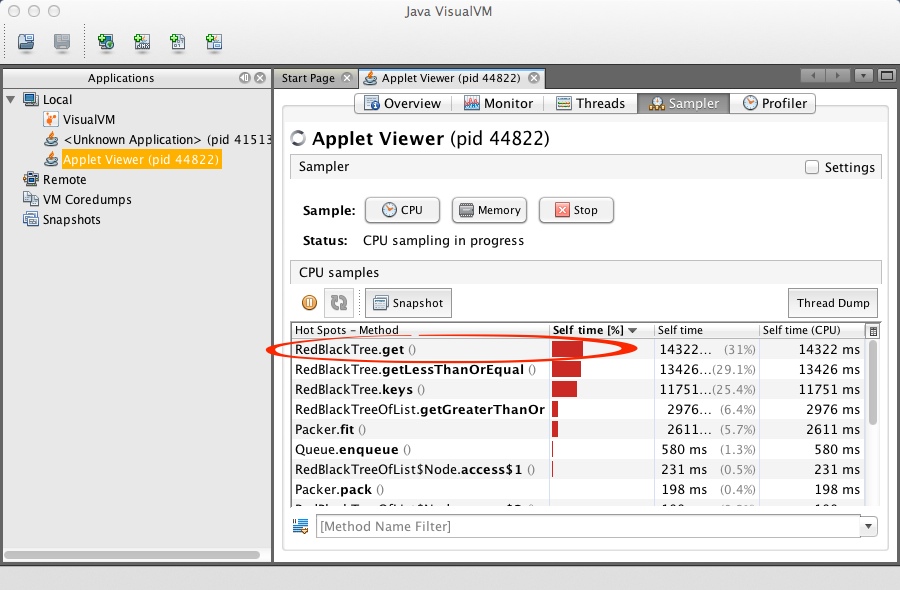
In the image above we see that our application is spending 31% of the processor time in the get() method of the RedBlackTree class, followed very closely by the getLessThanOrEqual() method of the same class.. Keys() is not far behind with 25% of the time used. So definitely these three methods account for roughly 85% of the time spent by the CPU on the packing algorithm.
If we were interested in speeding up the application, these would be the three we should look at first.
Memory
When you click on the Memory button, you get a list of the objects or data-structures that occupy the most amount of space in the heap.
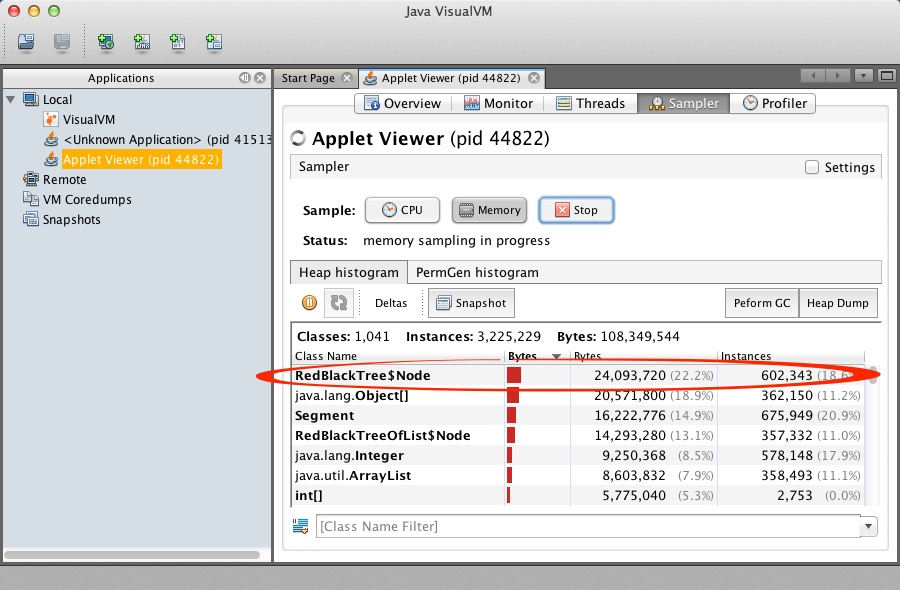
The image above shows that Node objects of the RedBlackTree class account for 22% of the memory space. Look at the number of objects, though: 602,343, taking a total of 24 MBytes. If we were to analyze the program closer we would find that the nodes actually hold segments that define band of free packing space, or rectangles. If we further look at the packing algorithm, we would notice that whenever a new rectangle is added, it generates only a handful of segments. Since we are packing 20,000 rectangles, the number of segments should be in the 100,000 range, but not 600 thousand. The reason we have so many is that some of these segments are actually dead, deleted objects, that haven't been caught up by the Garbage Collector (GC) yet.
Memory Leak
This leads us to the concept of memory leak. A memory leak occurs in an application when this application, while running, slowly fills up the heap with objects that are not officially deleted by the program. If an object that is not used by the program is not deleted, then it remains in memory and the GC cannot reclaim its space. It is as if the application is leaking objects in the heap, hence the name we give to this condition. If the number of bytes and number of instances in your application were to increase constantly and significantly in your program to the point of using up all the space, this could be an indication of a memory leak.
Profiler
The difference between Sampling and Profiling is provided by User npe on Slashdot (captured on 9/30/13):
- Sampling means taking many thread dumps and analyzing stack traces. This is usually faster, does not require runtime changes in your bytecode (which may break it), but is also less accurate.
- Profiling means instrumenting your classes and methods, so they "report" whenever they are run. This is more accurate, as it counts every invocation of instrumented method, not only those caught when the dump is done. However instrumentation means that the bytecode of your classes is changed, and this may break your program. Actually, for that reason, using profiling on large application servers (like JBoss, or WebLogic) often causes everything to die or hang.
Nicely said. The sampling is fast and does not modify the code, and therefore affects the application less. Profiling requires changing the code, and if you are after a particular bug or bad behavior, sometimes the action of profiling will hide the problem you're trying to recreate and uncover.
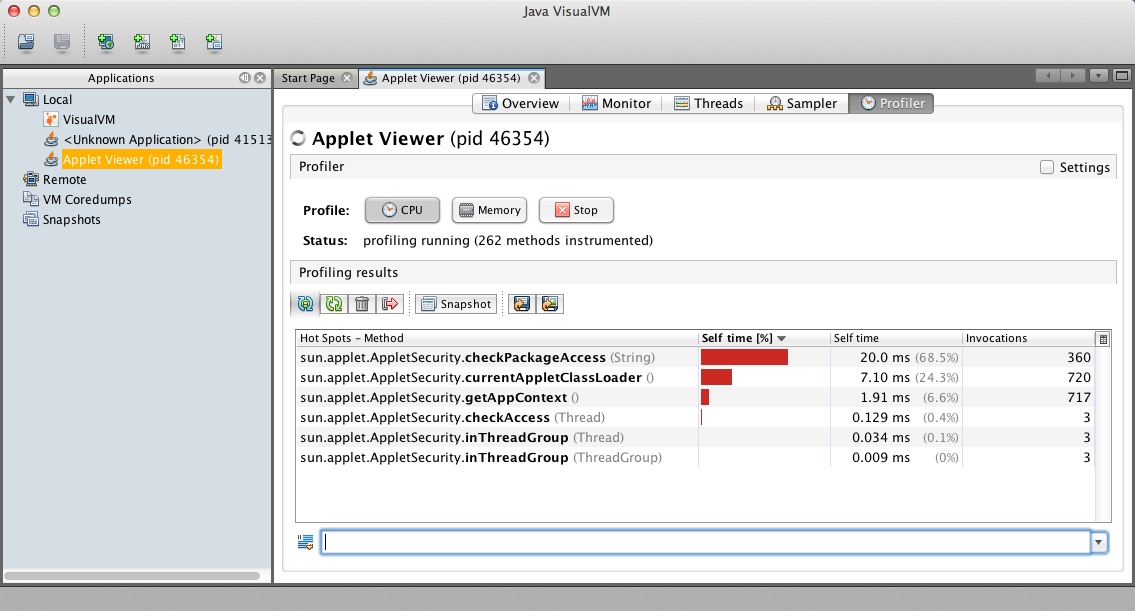
The figure below shows the result of profiling our packing application. Notice that the information displayed is quite different from what the sampler was showing.
Exercise |
- Look at the code for the three methods that seem to consume the most CPU and propose ways to reduce their execution time.
20,000 rectangles packed.
