Difference between revisions of "CSC111 Lab 11 2014"
(→Challenge 1: Two rectangles, random colors) |
(→Student-Submitted CSC) |
||
| (8 intermediate revisions by the same user not shown) | |||
| Line 11: | Line 11: | ||
=Installing the Graphics Library= | =Installing the Graphics Library= | ||
<br /> | <br /> | ||
| − | The graphics library written by Horstmann, the author of our textbook is available [[CSC111 Horstmann's Graphics Library|here]]. Download it and create a file called '''graphics.py''' in your current directory. | + | The graphics library written by Horstmann, the author of our textbook is available [[CSC111 Horstmann's Graphics Library|here]]. Download it and create a file called '''graphics.py''' in your current directory. This is an edited version of the original graphics library available on the Web site of the book's publisher. |
<br /> | <br /> | ||
| Line 194: | Line 194: | ||
<br /> | <br /> | ||
| − | * Repeat the | + | * Repeat the same experiments you did before using canvas methods, but this time use Circle objects: |
** first, two touching circle objects on the window. | ** first, two touching circle objects on the window. | ||
** next, touching Circle objects that cover the whole window. | ** next, touching Circle objects that cover the whole window. | ||
| Line 227: | Line 227: | ||
=A Wheel Class= | =A Wheel Class= | ||
<br /> | <br /> | ||
| − | * Create a new class, a wheel, that will contain 2 concentric circles. The wheel will be defined by the x,y coordinates of its center, | + | * Create a new class, a wheel, that will contain 2 concentric circles. The wheel will be defined by the '''x, y''' coordinates of its center, and the diameter of the outside circle (filled black). The diameter of its inside circle (light grey) does not need to be specified and will be equal (for example) to half the diameter of the larger circle. |
:Here is an example of how one would create and display a wheel: | :Here is an example of how one would create and display a wheel: | ||
| Line 248: | Line 248: | ||
<br /> | <br /> | ||
<source lang="python"> | <source lang="python"> | ||
| − | c = Car( 100,200, 400, 150, ( 255, 255, 0 ) ) | + | c = Car( 100, 200, 400, 150, ( 255, 255, 0 ) ) |
c.draw( canvas ) | c.draw( canvas ) | ||
| Line 270: | Line 270: | ||
Look in the '''graphics.py''' library for a canvas method that would allow you to draw text on the canvas. Once you figured out what you can use, add the word "Taxi" in the middle of the body of your car! | Look in the '''graphics.py''' library for a canvas method that would allow you to draw text on the canvas. Once you figured out what you can use, add the word "Taxi" in the middle of the body of your car! | ||
<br /> | <br /> | ||
| + | =Submission URL= | ||
| + | <br /> | ||
| + | Submit your program here: [http://cs.smith.edu/~thiebaut/111b/submitL11.php http://cs.smith.edu/~thiebaut/111b/submitL11.php]. | ||
| + | |||
| + | <br /> | ||
| + | |||
| + | <br /> | ||
| + | <br /> | ||
| + | <br /> | ||
| + | <br /> | ||
| + | <br /> | ||
| + | <br /> | ||
| + | <br /> | ||
| + | <br /> | ||
| + | <br /> | ||
| + | <br /> | ||
| + | <br /> | ||
| + | <br /> | ||
| + | <br /> | ||
| + | <br /> | ||
| + | <br /> | ||
| + | <br /> | ||
| + | <br /> | ||
| + | <br /> | ||
| + | <br /> | ||
| + | <br /> | ||
| + | <br /> | ||
| + | |||
| + | [[text4.txt | text4.txt ]] | ||
<!-- | <!-- | ||
=Solution Program= | =Solution Program= | ||
Latest revision as of 13:44, 23 April 2014
--D. Thiebaut (talk) 17:42, 13 April 2014 (EDT)
Contents
Object-Oriented Graphics
Installing the Graphics Library
The graphics library written by Horstmann, the author of our textbook is available here. Download it and create a file called graphics.py in your current directory. This is an edited version of the original graphics library available on the Web site of the book's publisher.
Simple Test
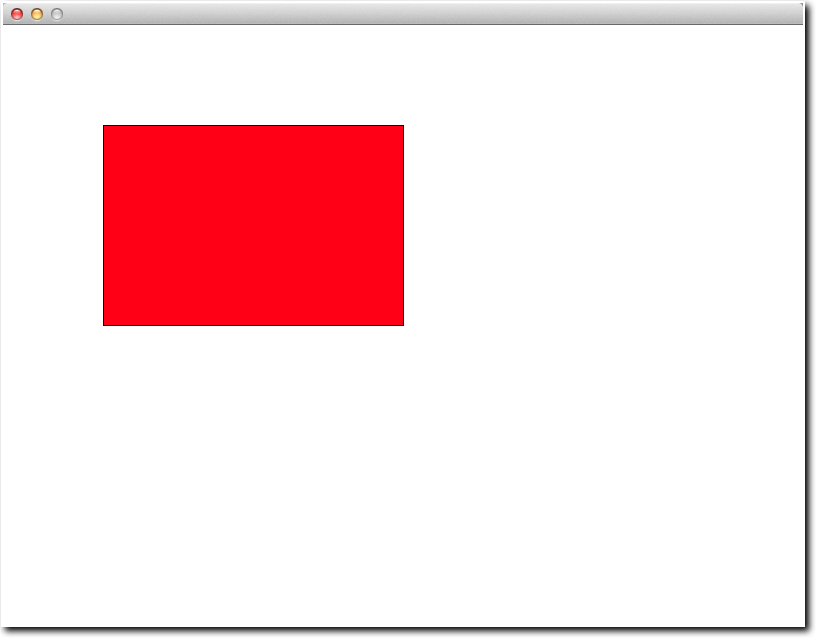
Verify that your library is correctly installed by running the python program below. Call it lab11.py. Make sure to save it in the same directory where you saved graphics.py.
from graphics import GraphicsWindow

MAXWIDTH = 800
MAXHEIGHT = 600


def main():
    win = GraphicsWindow(MAXWIDTH, MAXHEIGHT)
    canvas = win.canvas()

    canvas.setFill( 255, 0, 0  )    # full red
    canvas.drawRect( 100, 100, 300, 200 )

    win.wait()
    win.close()

main()
Challenge 1: Two rectangles, random colors |
- Change the color of the rectangle.
- Add a second rectangle with a different color
- Make the color of the two rectangles random.
- Hints: to generate a random number between 0 and 255, you can do this:
# at the top of the program
from random import seed
from random import randrange

# at the beginning of main()
seed()

# where you need a random number between 0 and 255 (included):
x = randrange( 256 )
Challenge 2: 500 random rects |
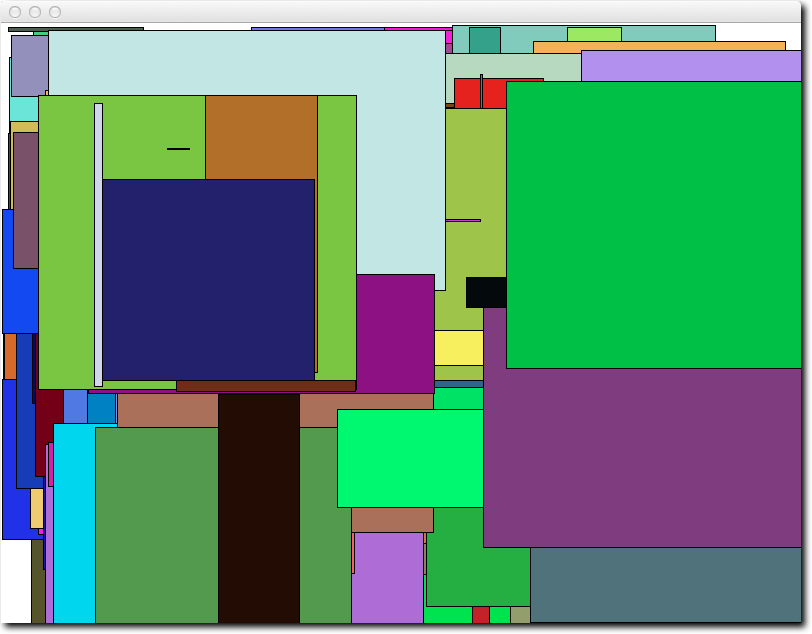
- Generate 500 random rectangles of random colors at random locations, and with random width and height.
Drawing circles
The graphics library also supports circles with the method drawOval( x, y, w, h ), where x, and y represent to top corner of the invisible rectangle that contains the oval, and w and h represent the width and height of the invisible rectangle.
canvas.drawOval( x, y, w, h )
Challenge 3: 2, random, many |
- Make the program display two circles of random colors side by side, horizontally
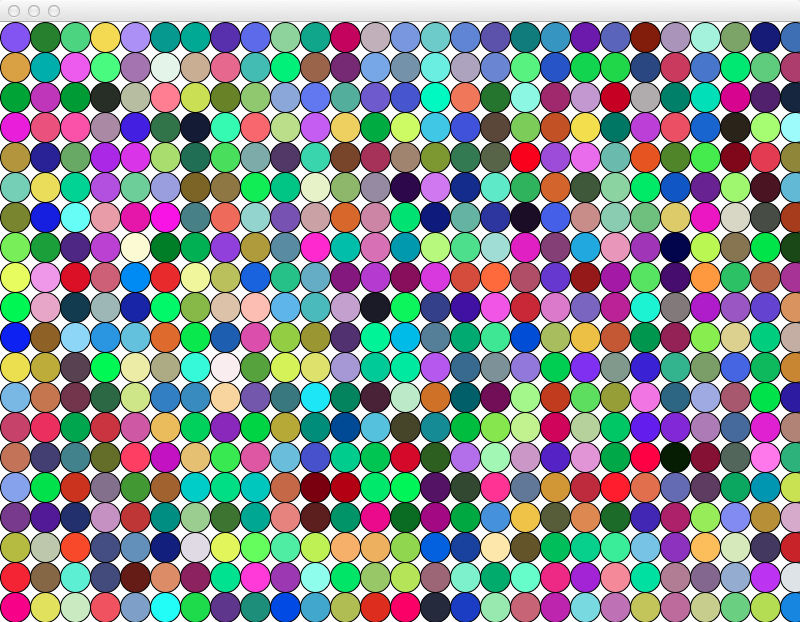
- Make your program display touching circles covering the whole window (hints: use nested for loops!)
Building a Rectangle Class
Add a new class to your program using the code below. The class holds a rectangle defined by the coordinates of its top corner, its width and height, and its color defined as a triplet of integers in the range 0 to 255, included.
from graphics import GraphicsWindow
from random   import randrange
from random   import seed
from time     import sleep

MAXWIDTH = 800
MAXHEIGHT= 600


class Rectangle:
    def __init__( self, x, y, width, height, color ):
        self._x      = x
        self._y      = y
        self._width  = width
        self._height = height
        self._color  = color   # list of 3 ints between 0 and 255

    def draw( self, canvas ):
        canvas.setFill( self._color[0], self._color[1], self._color[2] )
        canvas.drawRect( self._x, self._y, self._width, self._height )

def twoRects( canvas ):
    rect1 = Rectangle( 100, 100, 500, 20, (255, 0, 0 ) )
    rect1.draw( canvas )

    rect2 = Rectangle( 200, 200, 50, 200, (165, 76, 89 ) )
    rect2.draw( canvas )


def main():
    seed()
    win = GraphicsWindow(MAXWIDTH, MAXHEIGHT)
    canvas = win.canvas()

    twoRects( canvas )

    win.wait()
    win.close()


main()
Challenge 4: 500 Random Rectangle Objects |
Using objects of type Rectangle, repeat the earlier challenge that asked you to display 500 random rectangles of random colors.
Building a Circle Class
Using the example of the Rectangle class above, build a new class called Circle that will be used to create circle objects defined by
- the coordinates of the top corner of the invisible square containing the circle
- the width of the invisible square (this is also the diameter of the circle)
- the color of the circle, defined as a three integers in the range 0 to 255, included.
Challenge 5: |
- Repeat the same experiments you did before using canvas methods, but this time use Circle objects:
- first, two touching circle objects on the window.
- next, touching Circle objects that cover the whole window.
Centered Circle Objects
The way the coordinates of a circle are defined (top-left corner of enclosing rectangle) is not very useful. It will make our life simpler if we modify the class definition so that we can pass the coordinates of the center of the circle rather than of its top corner.
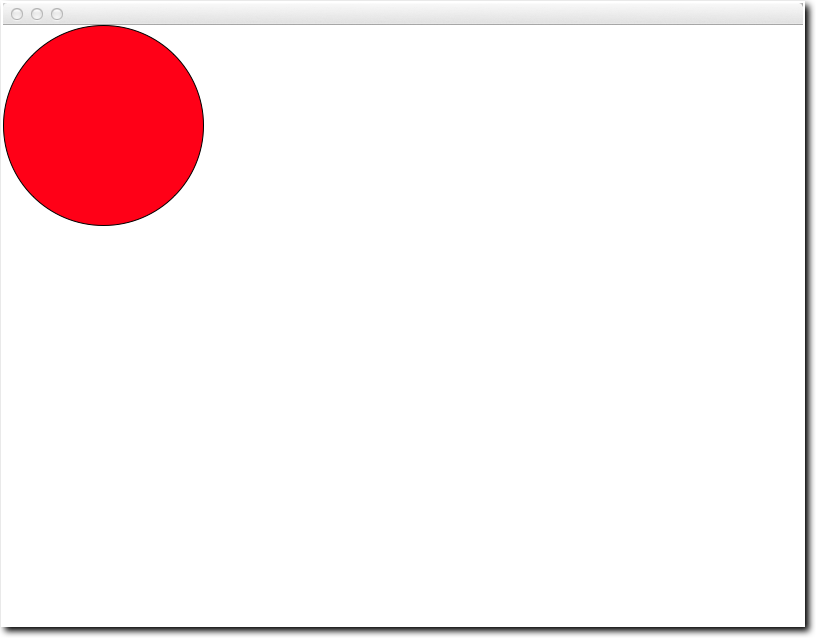
For example, if we wanted to create and display a red circle object centered on the point (100, 100), with diameter of 200, we would write:
  c = Circle( 100, 100, 200, (255, 0, 0 ) )
  c.draw( canvas )
which would show as follows:
- Test your new class and its ability to let us create centered circles.
A Wheel Class
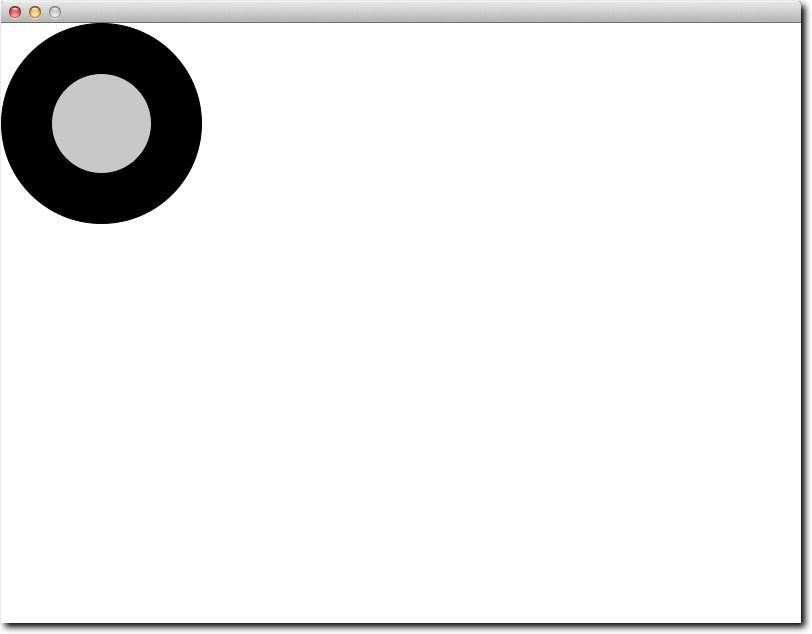
- Create a new class, a wheel, that will contain 2 concentric circles. The wheel will be defined by the x, y coordinates of its center, and the diameter of the outside circle (filled black). The diameter of its inside circle (light grey) does not need to be specified and will be equal (for example) to half the diameter of the larger circle.
- Here is an example of how one would create and display a wheel:
   w = Wheel( 100, 100, 200 )
   w.draw( canvas )
- and here's the way it looks:
Create a new Class that is a car
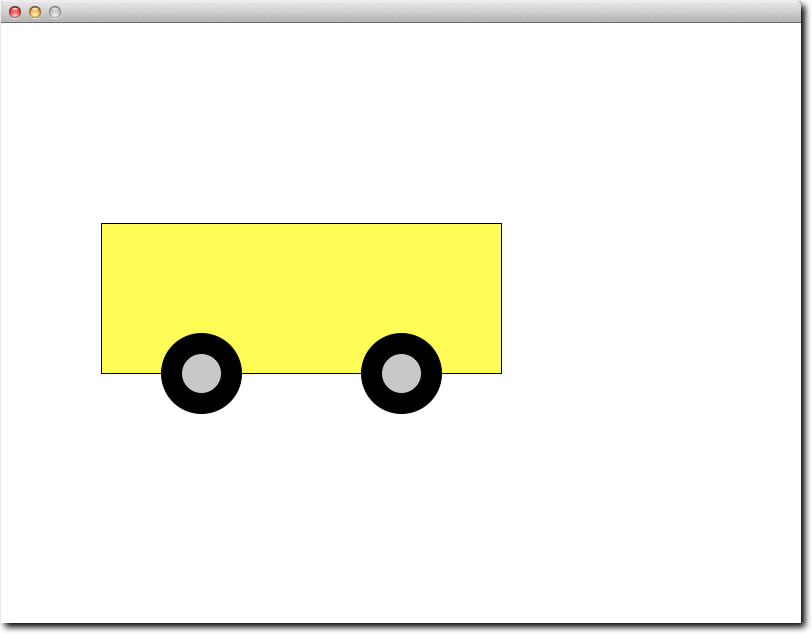
You should use graph paper for this part, and draw what you think is a nice looking box car. Paper will be provided in the lab. If you don't have any, though, use this free on-line service.
    c = Car( 100, 200, 400, 150, ( 255, 255, 0 ) )
    c.draw( canvas )
Create a car with a top
- add a top to your car
- add one or two windows to your car as well!
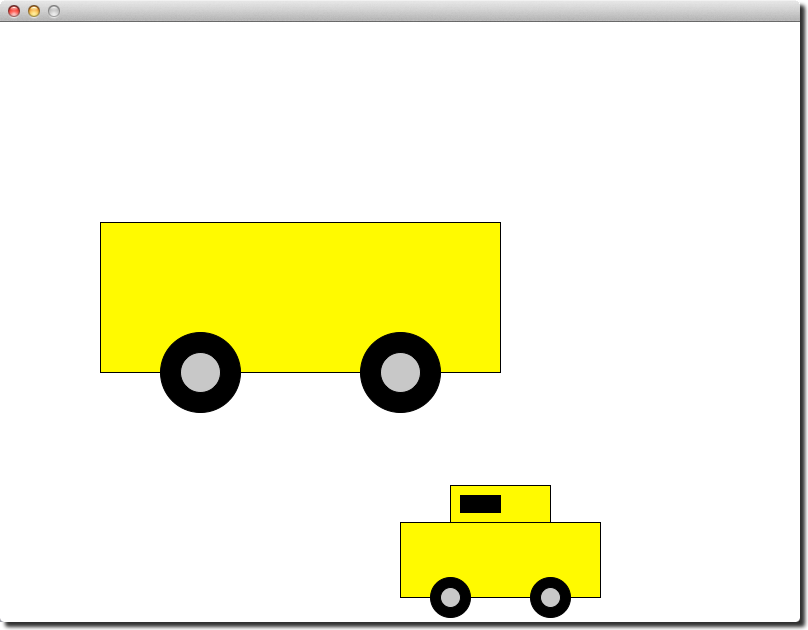
A convertible and a hard-top, side by side.
Ambitious? Make it a Taxi!
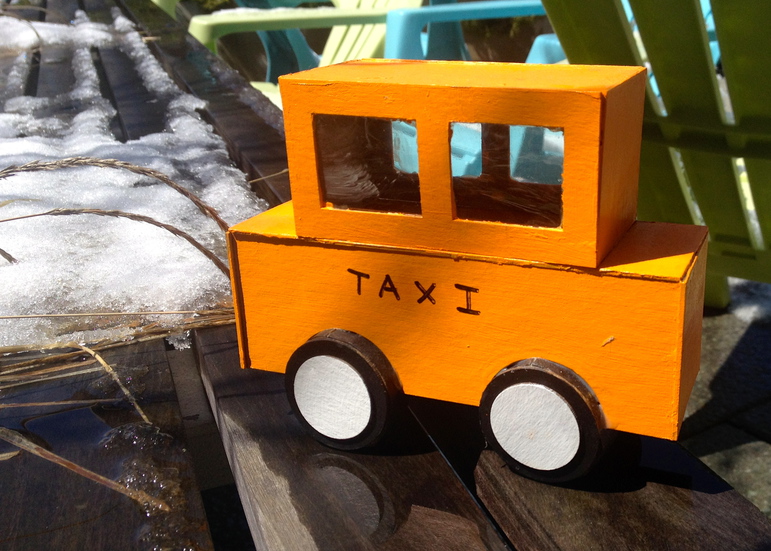
Look in the graphics.py library for a canvas method that would allow you to draw text on the canvas. Once you figured out what you can use, add the word "Taxi" in the middle of the body of your car!
Submission URL
Submit your program here: http://cs.smith.edu/~thiebaut/111b/submitL11.php.
