Difference between revisions of "CSC111 Lab 12 2014"
(→Mapping The Smith College Campus) |
(→A Beginning CSV) |
||
| (10 intermediate revisions by the same user not shown) | |||
| Line 282: | Line 282: | ||
After you have an idea of some of the possibility, pick some part of the options discussed above that you'd like to implement. | After you have an idea of some of the possibility, pick some part of the options discussed above that you'd like to implement. | ||
| + | <br /> | ||
| + | ==Some Hints About Drawing Polygons== | ||
| + | [[Image:CSC111BluePolygon.png|right|200px]]<br /> | ||
| + | If you are using the '''graphics111.py''' library, then drawing a polygon once you have a list of all its coordinates in a 1-dimensional list can be done as follows: | ||
| + | <br /> | ||
| + | :<source lang="python"> | ||
| + | # list of x, y coordinates: 10 numbers ==> 5 points | ||
| + | L = [100, 100, 200, 100, 300, 150, 200, 200, 100, 200 ] | ||
| + | |||
| + | # create a polygon object and draw it with color (205, 105, 205 ) | ||
| + | p = Polygon( L, (205, 105, 205) ) | ||
| + | p.draw( canvas ) | ||
| + | </source> | ||
| + | |||
| + | <br /> | ||
| + | <br /> | ||
| + | |||
| + | <br /> | ||
| + | <br /> | ||
| + | |||
| + | =Submission= | ||
| + | <br /> | ||
| + | The program for the first part should be called '''lab12a.py'''. The program to create a csv file for the map should be called '''lab12b.py'''. The program that reads the csv file and draws its contents should be called '''lab12c.py'''. | ||
| + | |||
| + | The URL for the submission: [http://cs.smith.edu/~thiebaut/111b/submitL12.php http://cs.smith.edu/~thiebaut/111b/submitL12.php] | ||
| + | <br /> | ||
| + | <br /> | ||
| + | <br /> | ||
| + | <br /> | ||
| + | <br /> | ||
| + | <br /> | ||
| + | <br /> | ||
| + | <br /> | ||
| + | <br /> | ||
| + | <br /> | ||
| + | <br /> | ||
| + | <br /> | ||
| + | <br /> | ||
| + | <br /> | ||
| + | <br /> | ||
| + | <br /> | ||
| + | <br /> | ||
| + | <br /> | ||
| + | <br /> | ||
| + | <br /> | ||
| + | <br /> | ||
| + | <br /> | ||
| + | <br /> | ||
| + | <br /> | ||
| + | <br /> | ||
| + | <br /> | ||
| + | <br /> | ||
| + | <br /> | ||
| + | <br /> | ||
| + | <br /> | ||
| + | <br /> | ||
| + | <br /> | ||
| + | <br /> | ||
| + | <br /> | ||
| + | <br /> | ||
| + | <br /> | ||
| + | <br /> | ||
| + | <br /> | ||
| + | <br /> | ||
| + | <br /> | ||
| + | <br /> | ||
| + | <br /> | ||
| + | <br /> | ||
| + | <br /> | ||
| + | <br /> | ||
| + | <br /> | ||
| + | |||
| + | <br /> | ||
| + | |||
| + | =A Beginning CSV= | ||
| + | <br /> | ||
| + | |||
| + | <source lang="text"> | ||
| + | Ford Hall, 358, 493, 371, 490, 383, 485, 387, 492, 391, 491, 401, 517, 410, 518, 413, 528, 407, 532, 421, 579, 420, 584, 422, 593, 415, 595, 415, 602, 406, 604, 403, 600, 400, 597, 394, 600, 391, 596, 388, 596, 366, 529 | ||
| + | Mendenhall Hall, 338, 497, 343, 512, 336, 512, 340, 522, 347, 520, 353, 543, 349, 546, 351, 556, 356, 556, 361, 572, 359, 583, 350, 581, 347, 576, 341, 577, 345, 594, 322, 601, 318, 595, 295, 599, 292, 598, 286, 597, 286, 601, 271, 606, 268, 600, 265, 585, 284, 581, 301, 574, 293, 532, 290, 529, 280, 529, 277, 515, 292, 511, 317, 503, 317, 498, 322, 496 | ||
| + | </source> | ||
| + | <br /> | ||
| + | <font color="magenta">Be sure to set your drawing window at least 800 pixels high to see these buildings!</font> | ||
| + | <br /> | ||
| + | <br /> | ||
| + | <br /> | ||
<br /> | <br /> | ||
<br /> | <br /> | ||
Latest revision as of 13:29, 24 April 2014
--D. Thiebaut (talk) 18:47, 21 April 2014 (EDT)
Contents
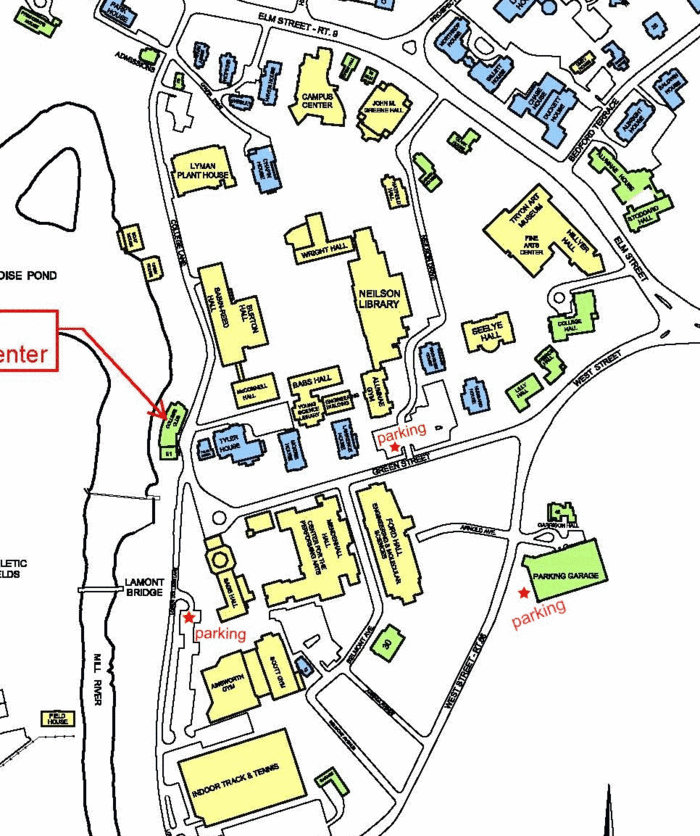
This lab is in two parts. The first part is a regular lab, with step-by-step instructions for building an event-driven program. The second part is a free-form lab that will start with a discussion, and a selection of several problems to be implemented for the lab. The main task for this part is to be able to display a partial map of the Smith campus to scale.
The current graphics library for this lab is graphics111.py
Building a car using the Graphics111 library
- Get a copy of the graphics111.py library
- Save it in your main directory (where you keep you python programs) and save it as graphics111.py
- Create a car using the new classes now available in the graphics111 library. Call it lab12.py.
from graphics111 import *

MAXWIDTH  = 600
MAXHEIGHT = 400

class Car:
    def __init__(self, x, y, w, h, color ):
        self._body = Rectangle( x, y, w, h, color )
        self._w1   = Wheel( x+w//4, y+h, w//4 )
        self._w2   = Wheel( x+3*w//4, y+h, w//4 )

    def draw( self, canvas ):
        self._body.draw( canvas )
        self._w1.draw( canvas )
        self._w2.draw( canvas )

def main():
    win = GraphicsWindow(MAXWIDTH, MAXHEIGHT)
    canvas = win.canvas()

    car = Car( 100, 100, 50, 20, (250, 250, 0) )
    car.draw( canvas )

    win.wait()
    win.close()

main()
- Notice how short the program is now that the classes for the wheels and rectangles are in the graphics111 library!
Adding A Menu
- Add a menu at the top left of the window. Don't try to activate it, it won't respond yet...
from graphics111 import *

MAXWIDTH  = 600
MAXHEIGHT = 400
class Car:
    def __init__(self, x, y, w, h, color ):
        self._body = Rectangle( x, y, w, h, color )
        self._w1   = Wheel( x+w//4, y+h, w//4 )
        self._w2   = Wheel( x+3*w//4, y+h, w//4 )

    def draw( self, canvas ):
        self._body.draw( canvas )
        self._w1.draw( canvas )
        self._w2.draw( canvas )


def main():
    win = GraphicsWindow(MAXWIDTH, MAXHEIGHT)
    canvas = win.canvas()

    menu = Menu()
    menu.draw( canvas )

    car = Car( 100, 100, 50, 20, (250, 250, 0) )
    car.draw( canvas )

    win.wait()
    win.close()

main()
A Bit of Hacking (optional)
- Figure out where the menu is located in the graphics111.py program, and change its color to red. All the symbols should show up in red when your modification is over.
Adding a Call-Back Function
- Modify your program and add a call-back function as shown below.
- Run it and click the mouse on the window, several times. Make sure you check the output in the console.
from graphics111 import *

MAXWIDTH  = 600
MAXHEIGHT = 400

class Car:
    def __init__(self, x, y, w, h, color ):
        self._body = Rectangle( x, y, w, h, color )
        self._w1   = Wheel( x+w//4, y+h, w//4 )
        self._w2   = Wheel( x+3*w//4, y+h, w//4 )

    def draw( self, canvas ):
        self._body.draw( canvas )
        self._w1.draw( canvas )
        self._w2.draw( canvas )

def mouseEvent( win, canvas, x, y ):
    print( "Caught an event. Received x=%d, y=%d" % (x,y) )

def main():
    global menu

    win = GraphicsWindow(MAXWIDTH, MAXHEIGHT)
    canvas = win.canvas()
    canvas.setCallbackFunction( mouseEvent )

    menu = Menu()
    menu.draw( canvas )

    car = Car( 100, 100, 50, 20, (250, 250, 0) )
    car.draw( canvas )

    win.wait()
    win.close()

main()
Challenge 1: Circles on Mouse-Clicks |
- Make your program generate a colored circle where ever the user clicks the mouse.
- Make the program generate red circles on the left side of the canvas, and green circles on the right side of the canvas.
Activating the Menu
Using the menu is now fairly easy. All we have to do is call its main method called buttonClicked( x, y ) which returns the name of the symbol clicked if the user pressed one, or None if the mouse was not clicked on the menu.
def mouseEvent( win, canvas, x, y ):
    global menu
    button = menu.buttonClicked( x, y )

    if button == "LeftArrow":
        print( "left-arrow clicked!" )
        return
    if button == "RightArrow":
        print( "right-arrow clicked!" )
        return
    if button == "Minus":
        print( "minus clicked!" )
        return
    if button == "Plus":
        print( "plus clicked!" )
        return
- Run your program.
- Click on the menu symbols and observe the printouts in the console. You should be able to detects clicks on the different symbols in the menu.
Menu-Driven Action
- Add a new method to your car that will move its body and its wheels by some distance dx in the horizontal direction, and dy in the vertical direction when called:
class Car:
    def __init__(self, x, y, w, h, color ):
        self._body = Rectangle( x, y, w, h, color )
        self._w1   = Wheel( x+w//4, y+h, w//4 )
        self._w2   = Wheel( x+3*w//4, y+h, w//4 )

    def draw( self, canvas ):
        self._body.draw( canvas )
        self._w1.draw( canvas )
        self._w2.draw( canvas )

    # move the car dx pixels to the right if dx is positive, dx pixels to the left if dx is negative.
    # move the car dy pixels down if dy is positive, dy pixels up if dy is negative.
    def move( self, canvas, dx, dy ):
        self._body.move( canvas, dx, dy )
        self._w1.move( canvas, dx, dy )
        self._w2.move( canvas, dx, dy )
- Make the call-back function move the car when the user clicks on the right-arrow in the menu.
def mouseEvent( win, canvas, x, y ):
    global menu
    global car
    button = menu.buttonClicked( x, y )

    if button == "LeftArrow":
        print( "left-arrow clicked!" )
        return
    if button == "RightArrow":
        print( "right-arrow clicked!" )
        car.move( canvas, 10, 0 )
        return
    if button == "Minus":
        print( "minus clicked!" )
        return
    if button == "Plus":
        print( "plus clicked!" )
        return
- make the car global in the main() function, the same way you made the menu global. This way the callback function mouseEvent() will be able to access the car object created in the main() function.
- Now run your program, and verify that the right arrow symbol can be used to move the car.
Challenge 2: Car moving Left and Right |
- Make the car move left when the left-arrow is clicked, and right when the right arrow is clicked.
Mapping The Smith College Campus
After you have an idea of some of the possibility, pick some part of the options discussed above that you'd like to implement.
Some Hints About Drawing Polygons
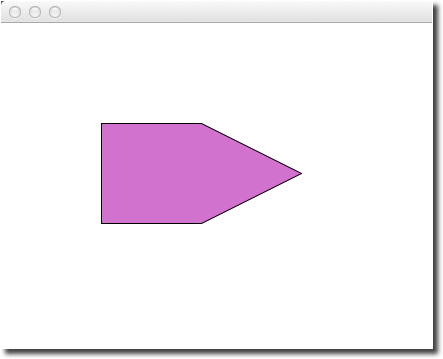
If you are using the graphics111.py library, then drawing a polygon once you have a list of all its coordinates in a 1-dimensional list can be done as follows:
   # list of x, y coordinates: 10 numbers ==> 5 points
   L = [100, 100, 200, 100, 300, 150, 200, 200, 100, 200 ]

   # create a polygon object and draw it with color (205, 105, 205 )
   p = Polygon( L,   (205, 105, 205) )
   p.draw( canvas )
Submission
The program for the first part should be called lab12a.py. The program to create a csv file for the map should be called lab12b.py. The program that reads the csv file and draws its contents should be called lab12c.py.
The URL for the submission: http://cs.smith.edu/~thiebaut/111b/submitL12.php
A Beginning CSV
Ford Hall, 358, 493, 371, 490, 383, 485, 387, 492, 391, 491, 401, 517, 410, 518, 413, 528, 407, 532, 421, 579, 420, 584, 422, 593, 415, 595, 415, 602, 406, 604, 403, 600, 400, 597, 394, 600, 391, 596, 388, 596, 366, 529
Mendenhall Hall, 338, 497, 343, 512, 336, 512, 340, 522, 347, 520, 353, 543, 349, 546, 351, 556, 356, 556, 361, 572, 359, 583, 350, 581, 347, 576, 341, 577, 345, 594, 322, 601, 318, 595, 295, 599, 292, 598, 286, 597, 286, 601, 271, 606, 268, 600, 265, 585, 284, 581, 301, 574, 293, 532, 290, 529, 280, 529, 277, 515, 292, 511, 317, 503, 317, 498, 322, 496
Be sure to set your drawing window at least 800 pixels high to see these buildings!


