Difference between revisions of "CSC111 Lab 7 2015b"
| (13 intermediate revisions by 2 users not shown) | |||
| Line 2: | Line 2: | ||
---- | ---- | ||
<br /> | <br /> | ||
| − | |||
| − | |||
| − | |||
| − | |||
| − | |||
| − | |||
| − | |||
| − | |||
| − | < | + | <showafterdate after="20151021 12:00" before="20151231 00:00"> |
| − | : | ||
| − | |||
| − | |||
| − | |||
| − | |||
| − | |||
| − | |||
| − | |||
| − | |||
| − | |||
| − | |||
| − | |||
| − | |||
| − | |||
| − | |||
| − | |||
| − | |||
| − | |||
| − | |||
| − | |||
| − | |||
| − | |||
| − | |||
| − | |||
| − | |||
| − | |||
| − | |||
| − | |||
| − | |||
| − | |||
| − | |||
| − | |||
| − | |||
| − | |||
| − | |||
| − | |||
| − | |||
| − | |||
| − | |||
| − | |||
| − | |||
| − | |||
<br /> | <br /> | ||
| − | + | <bluebox> | |
| − | + | In this lab you will play with a graphics library. A graphic library typically allows the user to draw simple shapes on the screen. You will also write some boolean functions that will help you control the dynamic movement of objects on the screen. When your programs for the challenges work, make sure to demonstrate your solutions to the lab instructor (or the TA). You must submit your solution program to Moodle before Friday 10/23/15 at 11:55 p.m. | |
<br /> | <br /> | ||
| − | + | ''' ''Note:'' Everything in this lab is new! Don't worry if you don't get everything right. The important thing is to get the graphics library to work, and for you to start understanding how to define simple graphic shapes. We will have a chance cover and review all these new functions and concepts in future lectures.''' | |
| − | |||
</bluebox> | </bluebox> | ||
<br /> | <br /> | ||
| − | |||
| − | |||
| − | |||
| − | |||
| − | |||
| − | |||
| − | |||
| − | |||
| − | |||
| − | |||
| − | |||
| − | |||
| − | |||
| − | |||
| − | |||
| − | |||
| − | |||
| − | |||
| − | |||
| − | |||
| − | |||
| − | |||
| − | |||
| − | |||
| − | |||
| − | |||
| − | |||
| − | |||
| − | |||
| − | |||
| − | |||
| − | |||
| − | |||
| − | |||
| − | |||
| − | |||
| − | |||
| − | |||
| − | |||
| − | |||
| − | |||
| − | |||
| − | |||
| − | |||
| − | |||
| − | |||
| − | |||
| − | |||
| − | |||
| − | |||
| − | |||
| − | |||
| − | |||
| − | |||
| − | |||
| − | |||
| − | |||
| − | |||
| − | |||
| − | |||
| − | |||
| − | |||
| − | |||
| − | |||
| − | |||
| − | |||
| − | |||
| − | |||
| − | |||
| − | |||
| − | |||
| − | |||
| − | |||
| − | |||
| − | |||
| − | |||
| − | |||
| − | |||
| − | |||
| − | |||
| − | |||
| − | |||
| − | |||
| − | |||
| − | |||
| − | |||
| − | |||
| − | |||
| − | |||
| − | |||
| − | |||
| − | |||
| − | |||
| − | |||
| − | |||
| − | |||
| − | |||
| − | |||
| − | |||
| − | |||
| − | |||
| − | |||
| − | |||
| − | |||
| − | |||
| − | |||
| − | |||
| − | |||
| − | |||
| − | |||
| − | |||
| − | |||
| − | |||
| − | |||
| − | |||
| − | |||
| − | |||
| − | |||
| − | |||
| − | |||
| − | |||
| − | |||
| − | |||
| − | |||
| − | |||
| − | |||
| − | |||
| − | |||
| − | |||
| − | |||
| − | |||
| − | |||
| − | |||
| − | |||
<br /> | <br /> | ||
| + | [[File:TaxiCabCSC111.png|150px|right]] | ||
<br /> | <br /> | ||
| − | + | =Reference= | |
<br /> | <br /> | ||
| − | + | * The short documentation for the graphics library we are going to be using for the rest of the semester is available [http://mcsp.wartburg.edu/zelle/python/graphics/graphics.pdf here]. | |
| − | |||
| − | |||
<br /> | <br /> | ||
| − | + | = Setting Up The Graphics Library= | |
| − | |||
| − | |||
| − | |||
| − | = | ||
<br /> | <br /> | ||
==Step 1: Download the graphics.py Library== | ==Step 1: Download the graphics.py Library== | ||
<br /> | <br /> | ||
| − | * Copy/Paste the code from this [ | + | * Copy/Paste the code from this [http://cs.smith.edu/dftwiki/index.php/Zelle%27s_Graphics.py_for_Python_3 page] to Idle and save it in the directory where you will save your programs for Week 7, under the name '''graphics.py'''. |
<br /> | <br /> | ||
==Step 2: Testing your installation== | ==Step 2: Testing your installation== | ||
| Line 224: | Line 34: | ||
* Click a few times on the window and verify that the window responds by changing the color or size of various graphic objects. | * Click a few times on the window and verify that the window responds by changing the color or size of various graphic objects. | ||
<br /> | <br /> | ||
| − | |||
| − | |||
| − | |||
| − | |||
<br /> | <br /> | ||
<br /> | <br /> | ||
Graphics programs have to be run from Idle to work correctly, and need the graphics.py library distributed by Zelle, the author of our textbook. | Graphics programs have to be run from Idle to work correctly, and need the graphics.py library distributed by Zelle, the author of our textbook. | ||
| − | |||
| − | |||
<br /> | <br /> | ||
==Step 3: A simple Graphics Program== | ==Step 3: A simple Graphics Program== | ||
| Line 308: | Line 112: | ||
<br /> | <br /> | ||
* The program uses 2 new objects: a rectangle, defined by its upper-left and bottom-right corners, and a label (text) that simply is a string of characters drawn at a given point on the screen. The string is automatically centered around the given point. | * The program uses 2 new objects: a rectangle, defined by its upper-left and bottom-right corners, and a label (text) that simply is a string of characters drawn at a given point on the screen. The string is automatically centered around the given point. | ||
| − | * | + | <br /> |
| + | <br /> | ||
| + | {| style="width:100%; background:silver" | ||
| + | |- | ||
| + | | | ||
| + | |||
| + | ==Challenge #1== | ||
| + | |} | ||
| + | [[Image:QuestionMark5.jpg|right|120px]] | ||
| + | <br /> | ||
| + | |||
| + | * Generate the figure below. Note that the graphics system used here can recognize many different colors, all defined by ''strings'', such as <font color="red">'red'</font> used above. You can find all the available colors on this [http://cs.smith.edu/dftwiki/index.php/Tk_Color_Names page]. | ||
<br /> | <br /> | ||
<center>[[Image:taxiCrude.png]]</center> | <center>[[Image:taxiCrude.png]]</center> | ||
<br /> | <br /> | ||
<br /> | <br /> | ||
| + | <br /> | ||
| + | <br /> | ||
| + | <br /> | ||
| + | =Mondrian= | ||
| + | [[Image:Mondrian_1.jpg|right|150px]] | ||
| + | <br /> | ||
| + | You may be familiar with Mondrian, the 20th century Dutch painter who painted geometric shapes on canvas, such as the one shown the right. In this section you are going to generate a computer graphic reminiscent of some of Mondrian's paintings. | ||
| + | <br /> | ||
| + | * First, create a program called '''Lab7_mondrian.py''' and initialize it with the program shown below. | ||
| + | <br /> | ||
| + | ::<source lang="python"> | ||
| + | # lab7_mondrian.py | ||
| + | # your name here | ||
| + | # generates a rectangle with a random width | ||
| + | # and height, and a given color on the screen. | ||
| + | |||
| + | from graphics import * | ||
| + | from random import * | ||
| + | |||
| + | def main(): | ||
| + | win = GraphWin("Lab 7", 600,600) | ||
| + | |||
| + | # create the coordinates of the top-left corner | ||
| + | x1 = 50 | ||
| + | y1 = 50 | ||
| + | |||
| + | # and of the bottom right corner (random) | ||
| + | x2 = randint(55, 600 ) | ||
| + | y2 = randint(55, 600 ) | ||
| + | |||
| + | # create rectangle with these 2 corners | ||
| + | r = Rectangle( Point(x1,y1), Point(x2, y2) ) | ||
| + | |||
| + | # create a color from 3 different RGB values | ||
| + | red = 255 # very red | ||
| + | green = 0 # not green at all | ||
| + | blue = 127 # mid blue | ||
| + | color = color_rgb( red, green, blue ) | ||
| + | |||
| + | # set the rectangle's color with this color | ||
| + | r.setFill( color ) | ||
| + | |||
| + | # draw the rectangle | ||
| + | r.draw( win ) | ||
| + | |||
| + | # wait for user to click on the window before closing | ||
| + | win.getMouse() | ||
| + | win.close() | ||
| + | |||
| + | main() | ||
| + | |||
| + | </source> | ||
| + | <br /> | ||
| + | * Run the program | ||
| + | * Verify that you get a bright pink rectangle. | ||
| + | <br /> | ||
| + | <br /> | ||
| + | <br /> | ||
| + | <!-- ----------------------------------------------------------------------------------------------- --> | ||
| + | {| style="width:100%; background:silver" | ||
| + | |- | ||
| + | | | ||
| + | ==Mondrian's Challenge== | ||
| + | |} | ||
| + | [[Image:QuestionMark8.jpg|right|120px]] | ||
| + | <br /> | ||
| + | * Modify the program and make it display something similar to this window (Note: My "art" is not much like Mondrian's. I sized and positioned my rectangles with only a concern for having a large number of them. ): | ||
| + | <br /> | ||
| + | <center>[[Image:Lab7Mondrian.png|500px]]</center> | ||
| + | <br /> | ||
| + | |||
=Simple Animation: Moving a Ball on the Graphic Window= | =Simple Animation: Moving a Ball on the Graphic Window= | ||
| Line 379: | Line 265: | ||
|- | |- | ||
| | | | ||
| − | ==Challenge | + | ==Challenge 2== |
|} | |} | ||
[[Image:QuestionMark1.jpg|right|120px]] | [[Image:QuestionMark1.jpg|right|120px]] | ||
| Line 395: | Line 281: | ||
| | | | ||
| − | ==Challenge | + | ==Challenge 3== |
|} | |} | ||
[[Image:QuestionMark2.jpg|right|120px]] | [[Image:QuestionMark2.jpg|right|120px]] | ||
<br /> | <br /> | ||
| − | * Modify your program | + | * Modify your program and replace the ball by a square. |
<br /> | <br /> | ||
<br /> | <br /> | ||
| Line 434: | Line 320: | ||
|- | |- | ||
| | | | ||
| − | ==Challenge | + | ==Challenge 4== |
|} | |} | ||
[[Image:QuestionMark3.jpg|right|120px]] | [[Image:QuestionMark3.jpg|right|120px]] | ||
| Line 451: | Line 337: | ||
| | | | ||
| − | ==Challenge | + | ==Challenge 5== |
|} | |} | ||
[[Image:QuestionMark4.jpg|right|120px]] | [[Image:QuestionMark4.jpg|right|120px]] | ||
| Line 505: | Line 391: | ||
|- | |- | ||
| | | | ||
| − | ==Challenge | + | ==Challenge 6== |
|} | |} | ||
[[Image:QuestionMark5.jpg|right|120px]] | [[Image:QuestionMark5.jpg|right|120px]] | ||
| Line 527: | Line 413: | ||
<br /> | <br /> | ||
<br /> | <br /> | ||
| + | <br /> | ||
| + | =Moodle Submission= | ||
| + | <br /> | ||
| + | * Take a screen capture of the graphics window showing the ball and the two obstacles, and submit the jpg or png file to Moodle, in the Lab 7 section. | ||
| + | :* Information on how to capture a portion of the screen on Macs can be found [https://support.apple.com/en-us/HT201361 here]. | ||
| + | :* Information on how to capture a portion of the screen on Windows can be found [http://windows.microsoft.com/en-us/windows/take-screen-capture-print-screen#take-screen-capture-print-screen=windows-8 here]. | ||
<br /> | <br /> | ||
| + | <!-- ================================================================ | ||
=Using Boolean Functions= | =Using Boolean Functions= | ||
<br /> | <br /> | ||
| Line 619: | Line 512: | ||
circ.setFill( color ) | circ.setFill( color ) | ||
</source> | </source> | ||
| + | ================================================================= --> | ||
<br /> | <br /> | ||
</showafterdate> | </showafterdate> | ||
<br /> | <br /> | ||
<br /> | <br /> | ||
| − | <showafterdate after=" | + | <showafterdate after="20151023 00:00" before "20151231 00:00"> |
=Solution Programs= | =Solution Programs= | ||
<br /> | <br /> | ||
The programs below show the evolution of the initial program through many transformations, solving the various challenges contained in this lab. | The programs below show the evolution of the initial program through many transformations, solving the various challenges contained in this lab. | ||
<br /> | <br /> | ||
| + | ==Mondrian.py== | ||
| + | <br /> | ||
| + | <source lang="python"> | ||
| + | # Lab7_Mondrian.py | ||
| + | from graphics import * | ||
| + | from random import * | ||
| + | |||
| + | def main(): | ||
| + | win = GraphWin("Lab 7", 600,600) | ||
| + | |||
| + | for i in range( 100 ): | ||
| + | x1 = randint(0, 600 ) | ||
| + | y1 = randint(0, 600 ) | ||
| + | x2 = randint(0, 600 ) | ||
| + | y2 = randint(0, 600 ) | ||
| + | |||
| + | r = Rectangle( Point(x1,y1), Point(x2, y2) ) | ||
| + | |||
| + | red = randint( 0, 255 ) | ||
| + | green = randint( 0, 255 ) | ||
| + | blue = randint( 0, 255 ) | ||
| + | |||
| + | color = color_rgb( red, green, blue ) | ||
| + | r.setFill( color ) | ||
| + | r.draw( win ) | ||
| + | |||
| + | win.getMouse() | ||
| + | win.close() | ||
| + | |||
| + | main() | ||
| + | |||
| + | </source> | ||
| + | <br /> | ||
| + | |||
==demo0.py== | ==demo0.py== | ||
<br /> | <br /> | ||
Latest revision as of 13:37, 21 October 2015
--D. Thiebaut (talk) 16:13, 17 October 2015 (EDT)
<showafterdate after="20151021 12:00" before="20151231 00:00">
In this lab you will play with a graphics library. A graphic library typically allows the user to draw simple shapes on the screen. You will also write some boolean functions that will help you control the dynamic movement of objects on the screen. When your programs for the challenges work, make sure to demonstrate your solutions to the lab instructor (or the TA). You must submit your solution program to Moodle before Friday 10/23/15 at 11:55 p.m.
Note: Everything in this lab is new! Don't worry if you don't get everything right. The important thing is to get the graphics library to work, and for you to start understanding how to define simple graphic shapes. We will have a chance cover and review all these new functions and concepts in future lectures.
Contents
Reference
- The short documentation for the graphics library we are going to be using for the rest of the semester is available here.
Setting Up The Graphics Library
Step 1: Download the graphics.py Library
- Copy/Paste the code from this page to Idle and save it in the directory where you will save your programs for Week 7, under the name graphics.py.
Step 2: Testing your installation
- With graphics.py in your Idle window, simply click run to run the library. Normally libraries are not run by themselves, but this library has its own test program to help users verify that the library is working properly.
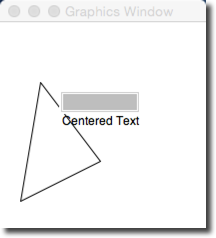
- If everything goes well, you should see this simple window appear on your screen:
- Click a few times on the window and verify that the window responds by changing the color or size of various graphic objects.
Graphics programs have to be run from Idle to work correctly, and need the graphics.py library distributed by Zelle, the author of our textbook.
Step 3: A simple Graphics Program
- Create a new program and call it lab7.py.
- Important: save your program in the same directory/folder where you saved the graphics.py library.
- Copy the code below in it.
# lab7.py
# your name
# draws a circle in a window that is 600x400.

from graphics import *

def main():
    win = GraphWin("My Circle", 600, 400)
    c = Circle(Point(50,50), 10)
    c.draw(win)
    win.getMouse() # Pause to view result
    win.close()    # Close window when done

main()
- Run the program. Verify that you see a single circle in the graphic window.
- Click with the mouse on the graphics window to close it.
Step 4: Explanations
- Observe the program from Step 3 above and recognize the main features:
- First we open a new graphic window on our desktop with the win = GraphWin( ... ) statement. 600 and 400 define how wide and high the window will be. "My Circle" is the title that will appear at the top of the window.
- Next, we create a circle object with the statement c = Circle( Point(50,50), 10 ). This does not draw the circle. It simply creates one in memory, centered on the point of coordinates 50, 50, with a radius of 10.
- Once the circle is created in memory, we make it appear on the graphic window with c.draw( win ).
- Finally, we wait for the user to click on the graphic window, and then close the window.
Step 5: Modifications
- Modify your program, so that it looks like the code shown below:
# lab7.py
# your name
# Uses graphics.py from Zelle
#
# This program displays a red circle, a label
# and a rectangle.
from graphics import *

def main():
    #open the graphic window.
    win = GraphWin( "Lab 7 Demo", 600, 400 )

    # create and draw a red circle
    center = Point( 100, 100 )
    circ = Circle( center, 30 )
    circ.setFill( 'red' )
    circ.draw( win )

    # add a label inside the circle
    label = Text( Point( 100, 100 ), "red circle" )
    label.draw( win )

    # create and draw a rectangle
    rect = Rectangle( Point( 30, 30 ), Point( 70, 70 ) )
    rect.draw( win )


    win.getMouse() # Pause to view result
    win.close()    # Close window when done

main()
- The program uses 2 new objects: a rectangle, defined by its upper-left and bottom-right corners, and a label (text) that simply is a string of characters drawn at a given point on the screen. The string is automatically centered around the given point.
Challenge #1 |
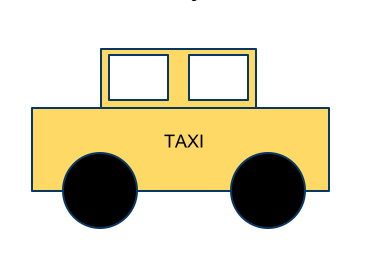
- Generate the figure below. Note that the graphics system used here can recognize many different colors, all defined by strings, such as 'red' used above. You can find all the available colors on this page.
Mondrian
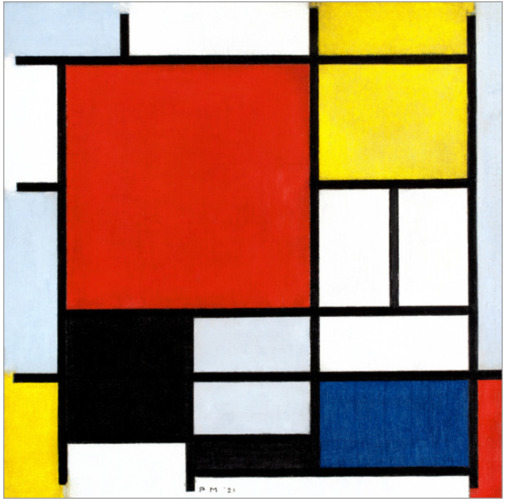
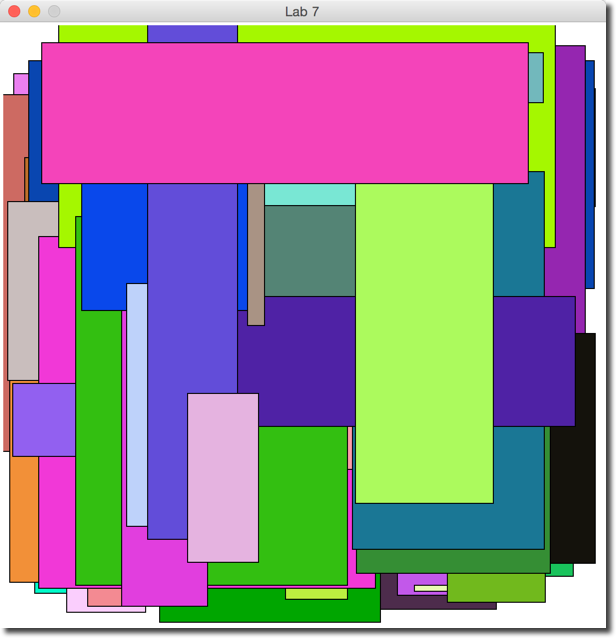
You may be familiar with Mondrian, the 20th century Dutch painter who painted geometric shapes on canvas, such as the one shown the right. In this section you are going to generate a computer graphic reminiscent of some of Mondrian's paintings.
- First, create a program called Lab7_mondrian.py and initialize it with the program shown below.
# lab7_mondrian.py
# your name here
# generates a rectangle with a random width
# and height, and a given color on the screen.

from graphics import *
from random import *

def main():
    win = GraphWin("Lab 7", 600,600)

    # create the coordinates of the top-left corner
    x1 = 50
    y1 = 50

    # and of the bottom right corner (random)
    x2 = randint(55, 600 )
    y2 = randint(55, 600 )

    # create rectangle with these 2 corners
    r = Rectangle( Point(x1,y1), Point(x2, y2) )

    # create a color from 3 different RGB values
    red   = 255    # very red
    green = 0      # not green at all
    blue  = 127    # mid blue
    color = color_rgb( red, green, blue )

    # set the rectangle's color with this color
    r.setFill( color )

    # draw the rectangle
    r.draw( win )

    # wait for user to click on the window before closing
    win.getMouse()
    win.close()

main()
- Run the program
- Verify that you get a bright pink rectangle.
Mondrian's Challenge |
- Modify the program and make it display something similar to this window (Note: My "art" is not much like Mondrian's. I sized and positioned my rectangles with only a concern for having a large number of them. ):
Simple Animation: Moving a Ball on the Graphic Window
- Create a new program similar to the one covered in Monday's lecture.
# Uses graphics.py from Zelle
#
# This program displays the basic elements of a program
#
from graphics import *

def main():
    win = GraphWin( "Lab 7 Moving ball", 600, 400 )

    # create and draw a red circle
    center = Point( 100, 100 )
    circ = Circle( center, 30 )
    circ.setFill( 'red' )
    circ.draw( win )

    # define the direction the circle will start moving in.
    # 5 pixels to the right every move, and 0.25 pixels down
    # every move.
    dx = 5
    dy = 0.25

    # as long as the mouse hasn't been clicked on the window
    # keep on looping.
    while win.checkMouse() == None:

        # move the circle in the current direction.
        circ.move( dx, dy )

        # get the x and y of the center of the circle.
        x = circ.getCenter().getX()
        y = circ.getCenter().getY()

        # if the center is outside the right or left boundary,
        # reverse the x direction of movement.
        if  x > 600 or x < 0:
            dx = -dx


    # if we're here, it's because the the user clicked on the graphic window.
    # we can close everything and quit.
    win.close()

main()
- Run the program. Verify that the circle/ball bounces off the left and right boundaries of the window, but disappears down the bottom of the screen. If the ball is moving too fast (it does run at various speeds depending on what computer you're running on), you may want to change the values assigned to dx and dy to these values:
dx = 0.025
dy = 0.025
- You can stop the program by clicking on the graphic window a couple of times.
Challenge 2 |
- Modify your program so that it makes the ball bounce off the bottom and top boundaries of the window.
Challenge 3 |
- Modify your program and replace the ball by a square.
Adding an Obstacle
- Add a rectangle in the middle of the graphic window. You should declare it at the beginning of your main() function, as illustrated here:
def main():
    win = GraphWin( "Lab 7 Moving ball", 600, 400 )

    # create a green obstacle in the middle of the window
    x1 = 200
    y1 = 200
    x2 = 250
    y2 = 250
    obstacle1 = Rectangle( Point( x1, y1 ), Point( x2, y2 ) )
    obstacle1.setFill( "green" )
    obstacle1.draw( win )

    # the remaining part of your code follows below...
Challenge 4 |
- Make your ball stop when its center enters the green rectangle. The image below illustrates this situation.
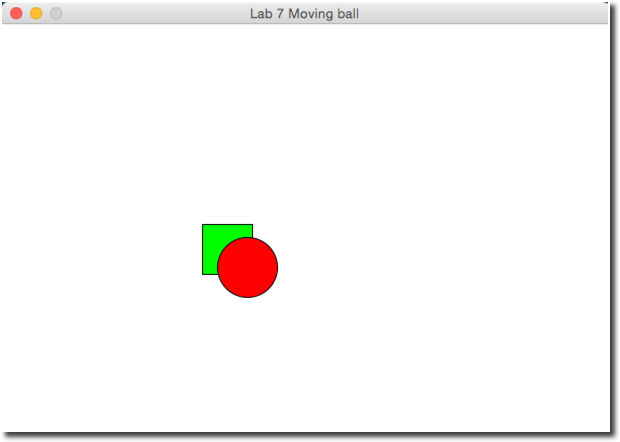
- Hints: to make an object stop, you can simply set its displacement to 0, so that the while-loop makes it move by 0 pixels every loop.
Challenge 5 |
- Modify your program one more time, and this time the ball will bounce off the obstacle. When you detect that the center of the ball is inside the green rectangle, change dx and dy to their opposite. Note that this will make the ball bounce back on the same path it came from. It is quite challenging to make the ball bounce in a realistic way, and you are welcome to try to make it happen, but it's trickier. Bouncing off in the opposite direction is fine for this lab!
if  ... :
    dx = -dx
    dy = -dy
Adding a Second Obstacle
- Add a second rectangle in the graphic window. Make it magenta in color. You should declare it at the beginning of your main() function, as illustrated here:
def main():
    win = GraphWin( "Lab 7 Moving ball", 600, 400 )

    # create a green obstacle in the middle of the window
    x1 = 200
    y1 = 200
    x2 = 250
    y2 = 250
    obstacle1 = Rectangle( Point( x1, y1 ), Point( x2, y2 ) )
    obstacle1.setFill( "green" )
    obstacle1.draw( win )

    # create another green rectangle on the right of the first one
    x3 = 350
    y3 = 200
    x4 = 400
    y4 = 250
    obstacle2 = Rectangle( Point( x3, y3 ), Point( x4, y4 ) )
    obstacle2.setFill( "magenta" )
    obstacle2.draw( win )


    # the remaining part of your code follows below...
- Feel freel to position it at a different location than the one used above.
Challenge 6 |
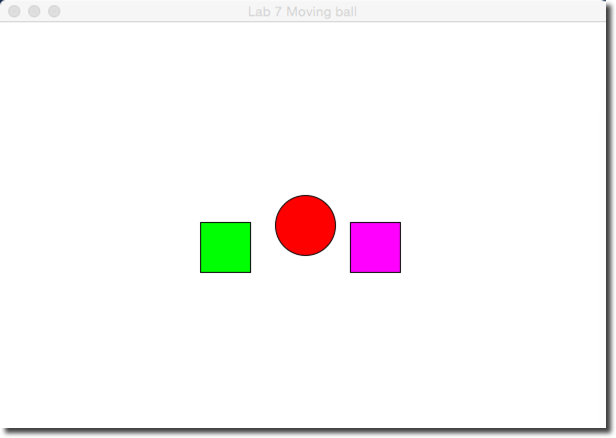
- Make your ball stop when its center is fully inside the first green obstacle, and bounce off the magenta obstacle. For this challenge, simply make the ball bounce off the second obstacle when its center enters the obstacle.
- If you find that the ball never gets to hit both boxes, you may want to change the initial direction and add decimal digits to the dx and dy to create an angle that yields a path that eventually will hit the obstacles. For example:
    dx = 5.111
    dy = -2.51
Moodle Submission
- Take a screen capture of the graphics window showing the ball and the two obstacles, and submit the jpg or png file to Moodle, in the Lab 7 section.
</showafterdate>
<showafterdate after="20151023 00:00" before "20151231 00:00">
Solution Programs
The programs below show the evolution of the initial program through many transformations, solving the various challenges contained in this lab.
Mondrian.py
# Lab7_Mondrian.py
from graphics import *
from random import *

def main():
    win = GraphWin("Lab 7", 600,600)

    for i in range( 100 ):
        x1 = randint(0, 600 )
        y1 = randint(0, 600 )
        x2 = randint(0, 600 )
        y2 = randint(0, 600 )

        r = Rectangle( Point(x1,y1), Point(x2, y2) )

        red   = randint( 0, 255 )
        green = randint( 0, 255 )
        blue  = randint( 0, 255 )

        color = color_rgb( red, green, blue )
        r.setFill( color )
        r.draw( win )

    win.getMouse()
    win.close()

main()
demo0.py
# Uses graphics.py from Zelle
#
# This program displays the basic elements of a program
#
from graphics import *

def main():
    win = GraphWin("Demo #0", 400, 300)
    c = Circle(Point(50,50), 10)
    c.draw(win)
    win.getMouse() # Pause to view result
    win.close()    # Close window when done

main()
demo1.py
# Uses graphics.py from Zelle
#
# This program displays the basic elements of a program
#
from graphics import *

def main():
    win = GraphWin("Demo #0", 600, 400)

    c1 = Circle( Point(50,150), 20 )
    c1.draw( win )
    c2 = Circle( Point( 100, 150 ), 20 )
    c2.draw( win )

    r1 = Rectangle( Point( 10, 100 ), Point( 150, 150 ) )
    r1.draw( win )

    win.getMouse() # Pause to view result
    win.close()    # Close window when done

main()
demo2.py
# Uses graphics.py from Zelle
#
# This program displays the basic elements of a program
#
from graphics import *

def main():
    win = GraphWin( "Lab 7 Demo", 600, 400 )

    # create and draw a red circle
    center = Point( 100, 100 )
    circ = Circle( center, 30 )
    circ.setFill( 'red' )
    circ.draw( win )

    # add a label inside the circle
    label = Text( center, "red circle" )
    label.draw( win )

    # create and draw a rectangle
    rect = Rectangle( Point( 30, 30 ), Point( 70, 70 ) )
    rect.draw( win )


    win.getMouse() # Pause to view result
    win.close()    # Close window when done

main()
demo3.py
# Uses graphics.py from Zelle
#
# This program displays the basic elements of a program
#
from graphics import *

def main():
    win = GraphWin( "Lab 7 Moving ball", 600, 400 )

    # create and draw a red circle
    center = Point( 100, 100 )
    circ = Circle( center, 30 )
    circ.setFill( 'red' )
    circ.draw( win )


    dx = 5
    dy = 0.25

    while win.checkMouse() == None:
        circ.move( dx, dy )
        x = circ.getCenter().getX()
        y = circ.getCenter().getY()
        if ( x > 600 ):
            dx = -dx
        if ( x < 0 ):
            dx = -dx


    win.close()    # Close window when done

main()
demo4.py
# Uses graphics.py from Zelle
#
# This program displays the basic elements of a program
#
from graphics import *

def main():
    win = GraphWin( "Lab 7 Moving ball", 600, 400 )

    # create a green obstacle in the middle of the window
    x1 = 200
    y1 = 200
    x2 = 250
    y2 = 250
    obstacle = Rectangle( Point( x1, y1 ), Point( x2, y2 ) )
    obstacle.setFill( "green" )
    obstacle.draw( win )

    # create and draw a red circle
    radius = 30
    center = Point( 100, 100 )
    circ = Circle( center, radius )
    circ.setFill( 'red' )
    circ.draw( win )

    # define the direction the circle will start moving in.
    # 5 pixels to the right every move, and 0.25 pixels down
    # every move.
    dx = 5
    dy = 2.5

    # as long as the mouse hasn't been clicked on the window
    # keep on looping.
    while win.checkMouse() == None:

        # move the circle in the current direction.
        circ.move( dx, dy )

        # get the x and y of the center of the circle.
        x = circ.getCenter().getX()
        y = circ.getCenter().getY()

        # if the center of the ball is outside the right or left boundary,
        # reverse the x direction of movement.
        if  x > 600 - radius or  x < radius:
            dx = -dx
        if  y > 400 - radius or y < radius:
            dy = -dy

        # if the center of the ball is inside the obstacle, stop
        # the ball.
        if  x1 < x < x2 and y1 < y < y2 :
            dx = 0
            dy = 0


    # if we're here, it's because the the user clicked on the graphic window.
    # we can close everything and quit.
    win.close()

main()
demo5.py
# Uses graphics.py from Zelle
#
# This program displays the basic elements of a program
#
from graphics import *

def main():
    win = GraphWin( "Lab 7 Moving ball", 600, 400 )

    # create a green obstacle in the middle of the window
    x1 = 200
    y1 = 200
    x2 = 250
    y2 = 250
    obstacle1 = Rectangle( Point( x1, y1 ), Point( x2, y2 ) )
    obstacle1.setFill( "green" )
    obstacle1.draw( win )

    # create another green rectangle on the right of the first one
    x3 = 350
    y3 = 200
    x4 = 400
    y4 = 250
    obstacle2 = Rectangle( Point( x3, y3 ), Point( x4, y4 ) )
    obstacle2.setFill( "magenta" )
    obstacle2.draw( win )

    # create and draw a red circle
    radius = 30
    center = Point( 100, 100 )
    circ = Circle( center, radius )
    circ.setFill( 'red' )
    circ.draw( win )

    # define the direction the circle will start moving in.
    # 5 pixels to the right every move, and 0.25 pixels down
    # every move.
    dx = 5.1
    dy = 2.51

    # as long as the mouse hasn't been clicked on the window
    # keep on looping.
    while win.checkMouse() == None:

        # move the circle in the current direction.
        circ.move( dx, dy )

        # get the x and y of the center of the circle.
        x = circ.getCenter().getX()
        y = circ.getCenter().getY()

        # if the center of the ball is outside the right or left boundary,
        # reverse the x direction of movement.
        if  x > 600 - radius or  x < radius:
            dx = -dx
        if  y > 400 - radius or y < radius:
            dy = -dy

        # if the center of the ball is inside the first obstacle, stop
        # the ball.
        if  x1 < x < x2 and y1 < y < y2 :
            dx = 0
            dy = 0

        # if the center of the ball is inside the second obstacle, bounce
        # off
        if  x3 < x < x4 and y3 < y < y4 :
            dx = -dx
            dy = -dy


    # if we're here, it's because the the user clicked on the graphic window.
    # we can close everything and quit.
    win.close()

main()
demo6.py
# Uses graphics.py from Zelle
#
# This program displays the basic elements of a program
#
from graphics import *

# ifInside: returns true of the coordinates of a point defined by
# its coordinates ballX and ballY, are inside the rectangle defined by a top
# left point of coordinates obsX1, obsY1, and a bottom-right point
# with coordinates obsX2, obsY2.   Returns false if the point is outside
# the rectangle.
def isInside( ballX, ballY, obsX1, obsY1, obsX2, obsY2 ):
    if obsX1 < ballX < obsX2 and obsY1 < ballY < obsY2:
        return True
    else:
        return False


def main():
    win = GraphWin( "Lab 7 Moving ball", 600, 400 )

    # create a green obstacle in the middle of the window
    x1 = 200
    y1 = 200
    x2 = 250
    y2 = 250
    obstacle1 = Rectangle( Point( x1, y1 ), Point( x2, y2 ) )
    obstacle1.setFill( "green" )
    obstacle1.draw( win )

    # create another green rectangle on the right of the first one
    x3 = 350
    y3 = 200
    x4 = 400
    y4 = 250
    obstacle2 = Rectangle( Point( x3, y3 ), Point( x4, y4 ) )
    obstacle2.setFill( "magenta" )
    obstacle2.draw( win )

    # create and draw a red circle
    radius = 30
    center = Point( 100, 100 )
    circ = Circle( center, radius )
    circ.setFill( 'red' )
    circ.draw( win )

    # define the direction the circle will start moving in.
    # 5 pixels to the right every move, and 0.25 pixels down
    # every move.
    dx = 5.111
    dy = -2.51

    # as long as the mouse hasn't been clicked on the window
    # keep on looping.
    while win.checkMouse() == None:

        # move the circle in the current direction.
        circ.move( dx, dy )

        # get the x and y of the center of the circle.
        x = circ.getCenter().getX()
        y = circ.getCenter().getY()

        # if the center of the ball is outside the right or left boundary,
        # reverse the x direction of movement.
        if  x > 600 - radius or  x < radius:
            dx = -dx
        if  y > 400 - radius or y < radius:
            dy = -dy

        # if the center of the ball is inside the first obstacle, stop
        # the ball.
        if  isInside( x, y, x1, y1, x2, y2 ):
            dx = 0
            dy = 0

        # if the center of the ball is inside the second obstacle, bounce
        # off
        if  isInside( x, y, x3, y3, x4, y4 ):
            dx = -dx
            dy = -dy


    # if we're here, it's because the the user clicked on the graphic window.
    # we can close everything and quit.
    win.close()

main()
demo7.py
# Uses graphics.py from Zelle
#
# This program displays the basic elements of a program
#
from graphics import *

# ifInside: returns true of the coordinates of a point defined by
# its coordinates ballX and ballY, are inside the rectangle defined by a top
# left point of coordinates obsX1, obsY1, and a bottom-right point
# with coordinates obsX2, obsY2.   Returns false if the point is outside
# the rectangle.
def isInside( ballX, ballY, obsX1, obsY1, obsX2, obsY2 ):
    if obsX1 < ballX < obsX2 and obsY1 < ballY < obsY2:
        return True
    else:
        return False

def isLeftSide( x, y, width ):
    if x < width//2:
        return True
    else:
        return False

def main():
    win = GraphWin( "Lab 7 Moving ball", 600, 400 )

    # create a green obstacle in the middle of the window
    x1 = 200
    y1 = 200
    x2 = 250
    y2 = 250
    obstacle1 = Rectangle( Point( x1, y1 ), Point( x2, y2 ) )
    obstacle1.setFill( "green" )
    obstacle1.draw( win )

    # create another green rectangle on the right of the first one
    x3 = 350
    y3 = 200
    x4 = 400
    y4 = 250
    obstacle2 = Rectangle( Point( x3, y3 ), Point( x4, y4 ) )
    obstacle2.setFill( "magenta" )
    obstacle2.draw( win )

    # create and draw a red circle
    radius = 30
    center = Point( 100, 100 )
    circ = Circle( center, radius )
    circ.setFill( 'red' )
    circ.draw( win )

    # define the direction the circle will start moving in.
    # 5 pixels to the right every move, and 0.25 pixels down
    # every move.
    dx = 5.111
    dy = -2.51

    # as long as the mouse hasn't been clicked on the window
    # keep on looping.
    while win.checkMouse() == None:

        # move the circle in the current direction.
        circ.move( dx, dy )

        # get the x and y of the center of the circle.
        x = circ.getCenter().getX()
        y = circ.getCenter().getY()

        # if the center of the ball is outside the right or left boundary,
        # reverse the x direction of movement.
        if  x > 600 - radius or  x < radius:
            dx = -dx
        if  y > 400 - radius or y < radius:
            dy = -dy

        # if the center of the ball is inside the first obstacle, stop
        # the ball.
        if  isInside( x, y, x1, y1, x2, y2 ):
            dx = 0
            dy = 0

        # if the center of the ball is inside the second obstacle, bounce
        # off
        if  isInside( x, y, x3, y3, x4, y4 ):
            dx = -dx
            dy = -dy

        # if the ball is on the left side of the window, its color is
        # red, else its color is yellow.
        if isLeftSide( x, y, win.getWidth() )==True:
            circ.setFill( 'red' )
        else:
            circ.setFill( 'yellow' )


    # if we're here, it's because the the user clicked on the graphic window.
    # we can close everything and quit.
    win.close()

main()
demo8.py
# Uses graphics.py from Zelle
#
# This program displays the basic elements of a program
#
from graphics import *

# ifInside: returns true of the coordinates of a point defined by
# its coordinates ballX and ballY, are inside the rectangle defined by a top
# left point of coordinates obsX1, obsY1, and a bottom-right point
# with coordinates obsX2, obsY2.   Returns false if the point is outside
# the rectangle.
def isInside( ballX, ballY, obsX1, obsY1, obsX2, obsY2 ):
    if obsX1 < ballX < obsX2 and obsY1 < ballY < obsY2:
        return True
    else:
        return False

def isLeftSide( x, y, width ):
    if x < width//2:
        return True
    else:
        return False

def getColor( x, y, w, h ):
    if x < w/2 and y < h/2:
        return 'yellow'
    elif x < w/2 and y > h/2:
        return 'blue'
    elif x > w/2 and y < h/2:
        return 'red'
    else:
        return 'brown'

def main():
    win = GraphWin( "Lab 7 Moving ball", 600, 400 )

    # create a green obstacle in the middle of the window
    x1 = 200
    y1 = 200
    x2 = 250
    y2 = 250
    obstacle1 = Rectangle( Point( x1, y1 ), Point( x2, y2 ) )
    obstacle1.setFill( "green" )
    obstacle1.draw( win )

    # create another green rectangle on the right of the first one
    x3 = 350
    y3 = 200
    x4 = 400
    y4 = 250
    obstacle2 = Rectangle( Point( x3, y3 ), Point( x4, y4 ) )
    obstacle2.setFill( "magenta" )
    obstacle2.draw( win )

    # create and draw a red circle
    radius = 30
    center = Point( 100, 100 )
    circ = Circle( center, radius )
    circ.setFill( 'red' )
    circ.draw( win )

    # define the direction the circle will start moving in.
    # 5 pixels to the right every move, and 0.25 pixels down
    # every move.
    dx = 5.111
    dy = -2.51

    # as long as the mouse hasn't been clicked on the window
    # keep on looping.
    while win.checkMouse() == None:

        # move the circle in the current direction.
        circ.move( dx, dy )

        # get the x and y of the center of the circle.
        x = circ.getCenter().getX()
        y = circ.getCenter().getY()

        circ.setFill( getColor( x, y, win.getWidth(), win.getHeight() ) )

        # if the center of the ball is outside the right or left boundary,
        # reverse the x direction of movement.
        if  x > 600 - radius or  x < radius:
            dx = -dx
        if  y > 400 - radius or y < radius:
            dy = -dy

        # if the center of the ball is inside the first obstacle, stop
        # the ball.
        if  isInside( x, y, x1, y1, x2, y2 ):
            dx = 0
            dy = 0

        # if the center of the ball is inside the second obstacle, bounce
        # off
        if  isInside( x, y, x3, y3, x4, y4 ):
            dx = -dx
            dy = -dy

        # if the ball is on the left side of the window, its color is
        # red, else its color is yellow.
        """
        if isLeftSide( x, y, win.getWidth() )==True:
            circ.setFill( 'red' )
        else:
            circ.setFill( 'yellow' )
        """

    # if we're here, it's because the the user clicked on the graphic window.
    # we can close everything and quit.
    win.close()

main()
</showafterdate>
