Difference between revisions of "Student Poster at NCUR2017 Conference"
(→National Conference on Undergraduate ResearchMemphis, Tennessy, April 6-8, 2017) |
(→National Conference on Undergraduate ResearchMemphis, Tennessy, April 6-8, 2017) |
||
| Line 6: | Line 6: | ||
The abstract of the poster is the following | The abstract of the poster is the following | ||
<br /> | <br /> | ||
| − | + | <blockquote> | |
We present a novel data visualization that displays the con- tact trace of the spread of an infection. This visualization presents the spread as a radial organizational chart, where each node is an infected person, and the distance from the root to a node is proportional to time. We use real regis- tration information for a population of students at a small college to generate a social network that is fed to an agent- based simulator. The simulation implements the SIR model to control how the infection moves from individual to an- other. Contrarily to other models that generate expected quantities, our tool displays scenarios of a typical outbreak, where individual involved in the spread are identified, along with the trace of their infection. The usefulness of our tool is in illustrating at the micro level phenomena such as the ap- pearance of super-spreaders, or the influence of interventions such as quarantine or vaccination. We present several visu- alizations corresponding to different SIR parameters, and also illustrating the effect of vaccination. | We present a novel data visualization that displays the con- tact trace of the spread of an infection. This visualization presents the spread as a radial organizational chart, where each node is an infected person, and the distance from the root to a node is proportional to time. We use real regis- tration information for a population of students at a small college to generate a social network that is fed to an agent- based simulator. The simulation implements the SIR model to control how the infection moves from individual to an- other. Contrarily to other models that generate expected quantities, our tool displays scenarios of a typical outbreak, where individual involved in the spread are identified, along with the trace of their infection. The usefulness of our tool is in illustrating at the micro level phenomena such as the ap- pearance of super-spreaders, or the influence of interventions such as quarantine or vaccination. We present several visu- alizations corresponding to different SIR parameters, and also illustrating the effect of vaccination. | ||
</blockquote> | </blockquote> | ||
Revision as of 21:39, 15 February 2017
National Conference on Undergraduate ResearchMemphis, Tennessy, April 6-8, 2017
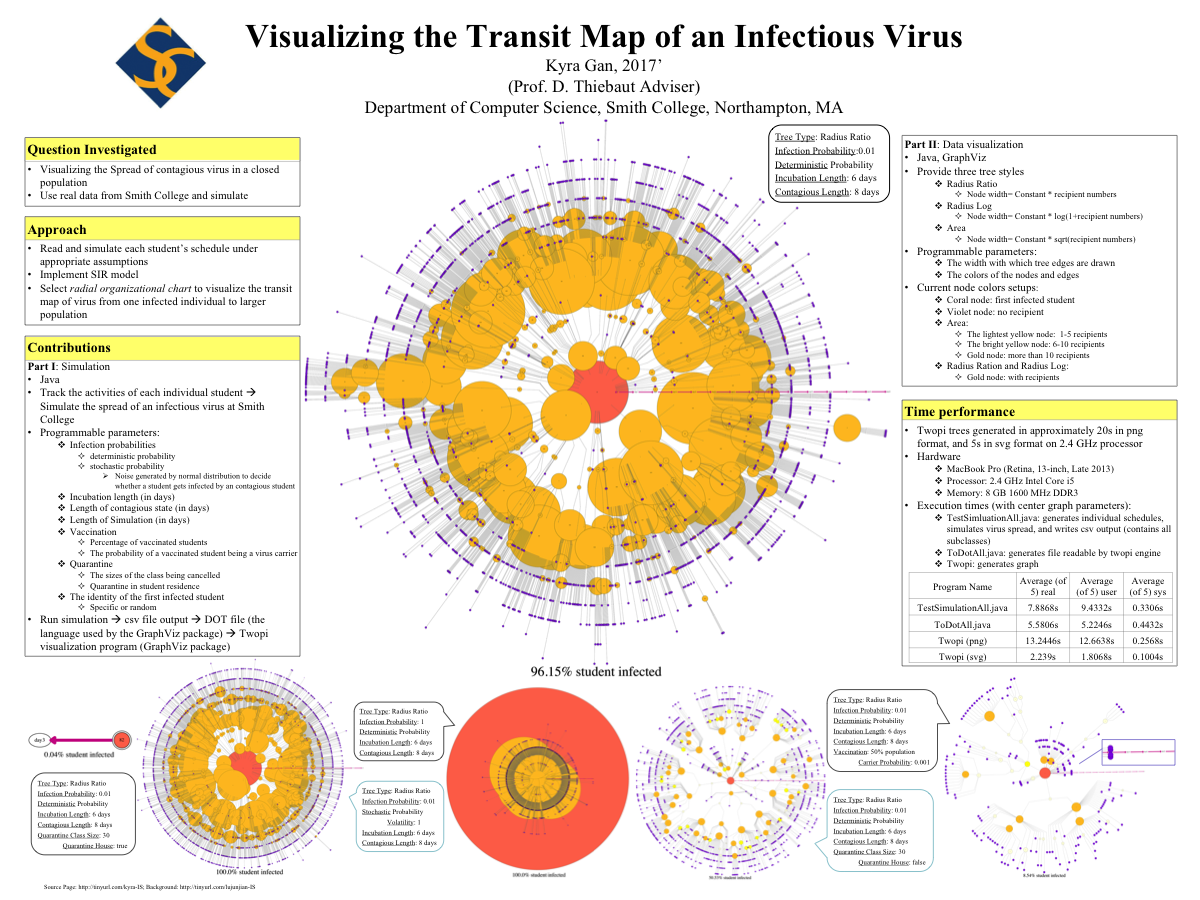
I worked with Kyra Gan, '2017, during the Spring 16 semester on an independent study, during which she studied how to best visualize the spread of a disease in a closed population. As part of her research work, Kyra created a poster, and we were very pleased to see it accepted for presentation at the National Conference on Undergraduate Research, in Memphis, TN, in April 2017.
The abstract of the poster is the following
We present a novel data visualization that displays the con- tact trace of the spread of an infection. This visualization presents the spread as a radial organizational chart, where each node is an infected person, and the distance from the root to a node is proportional to time. We use real regis- tration information for a population of students at a small college to generate a social network that is fed to an agent- based simulator. The simulation implements the SIR model to control how the infection moves from individual to an- other. Contrarily to other models that generate expected quantities, our tool displays scenarios of a typical outbreak, where individual involved in the spread are identified, along with the trace of their infection. The usefulness of our tool is in illustrating at the micro level phenomena such as the ap- pearance of super-spreaders, or the influence of interventions such as quarantine or vaccination. We present several visu- alizations corresponding to different SIR parameters, and also illustrating the effect of vaccination.
Kyra's poster:
