Difference between revisions of "CSC270 Tektronix Scope Lab"
(→Discover!) |
(→Discover!) |
||
| (9 intermediate revisions by the same user not shown) | |||
| Line 1: | Line 1: | ||
| − | --[[User:Thiebaut|D. Thiebaut]] | + | --[[User:Thiebaut|D. Thiebaut]] ([[User talk:Thiebaut|talk]]) 11:49, 16 February 2016 (EST) |
---- | ---- | ||
| + | |||
<bluebox> | <bluebox> | ||
This lab is an introduction to the use of the Tektronix MSO3000/DPO3000 Oscilloscope. | This lab is an introduction to the use of the Tektronix MSO3000/DPO3000 Oscilloscope. | ||
| Line 8: | Line 9: | ||
=Reference Material= | =Reference Material= | ||
| − | * You can find annotated copies of the manual on[http://www.science.smith.edu/~jcardell/Courses/EGR220/labs/LabManuals.pdf Judy Cardell's site]. | + | * You can find annotated copies of the manual on [http://www.science.smith.edu/~jcardell/Courses/EGR220/labs/LabManuals.pdf Judy Cardell's site]. |
* The original manual of the scope can be found [http://cs.smith.edu/~thiebaut/classes/270/HP_DPOScope3034.pdf here]. The good part starts on Page 29! | * The original manual of the scope can be found [http://cs.smith.edu/~thiebaut/classes/270/HP_DPOScope3034.pdf here]. The good part starts on Page 29! | ||
| Line 30: | Line 31: | ||
[[Image:TextronixScopeFace1.jpg|right|200px|right]] | [[Image:TextronixScopeFace1.jpg|right|200px|right]] | ||
* Turn on the scope (bottom left button on face). | * Turn on the scope (bottom left button on face). | ||
| − | * Turn on the board (make sure the battery is fully engaged in its connector). | + | * Turn on the board (make sure the battery is fully engaged in its connector) by pressing on the button near the battery. A red LED should turn on. |
* Connect Probe 1 to TP 1, and ground it, i.e. connect the alligator clip to the GND connector on the board. | * Connect Probe 1 to TP 1, and ground it, i.e. connect the alligator clip to the GND connector on the board. | ||
| + | * Press the ''yellow'' '''1''' button right over the probe. | ||
* Press '''AUTOSET''' (black button, middle right of face) | * Press '''AUTOSET''' (black button, middle right of face) | ||
* You should get your first waveform, which is referred to as a square wave. | * You should get your first waveform, which is referred to as a square wave. | ||
| Line 47: | Line 49: | ||
<br /> | <br /> | ||
| − | =Measuring | + | =Measuring waveforms: time and amplitude= |
* The scope has two horizontal cursors you can move around, as well as two vertical cursors that allow you to measure time differences (horizontally) and voltages (vertically). | * The scope has two horizontal cursors you can move around, as well as two vertical cursors that allow you to measure time differences (horizontally) and voltages (vertically). | ||
| − | * The cursors are turned On/Off by the small '''Cursors''' button (top left of the face). | + | * The cursors are turned On/Off by using the small '''Cursors''' button (top left of the face). |
| + | |||
| + | ==Time Measurements== | ||
<br /> | <br /> | ||
<tanbox> | <tanbox> | ||
;Question | ;Question | ||
| − | :What is the length of one period? | + | :What is the length of one period of the signal? What is its frequency? |
</tanbox> | </tanbox> | ||
<br /> | <br /> | ||
| − | + | To answer this question: | |
| − | |||
* Move the 2 vertical cursors to measure a full period of the signal. Report the time you measure. | * Move the 2 vertical cursors to measure a full period of the signal. Report the time you measure. | ||
* Click on '''Measure''' (center top), which will bring in a menu at the bottom of the screen. | * Click on '''Measure''' (center top), which will bring in a menu at the bottom of the screen. | ||
| − | * Click on '''Configure Cursors''' and set the cursor mode to display Hz instead of seconds. Click on '''Configure Cursors''' one more time to remove the menus from the screen. | + | * Click on '''Configure Cursors''' and set the cursor mode to display '''Hz''' instead of seconds. Click on '''Configure Cursors''' one more time to remove the menus from the screen. |
| − | + | * What is the frequency reported by the scope? Is it 1/period? | |
| − | |||
| − | |||
| − | |||
| − | |||
| − | |||
<br /> | <br /> | ||
| − | |||
==Voltage Measurements== | ==Voltage Measurements== | ||
| − | |||
| − | |||
| − | |||
| − | |||
<br /> | <br /> | ||
<tanbox> | <tanbox> | ||
| Line 83: | Line 76: | ||
</tanbox> | </tanbox> | ||
<br /> | <br /> | ||
| − | + | To answer this question: | |
| + | * Click on '''Cursors''' another time to control both horizontal and vertical cursors | ||
| + | * Use the '''Select''' button to switch between horizontal and vertical cursors | ||
| + | * Use the '''Multipurpose a''' and '''Multipurpose b''' buttons to move the cursors. | ||
| + | * Measure the amplitude, in volts. | ||
<br /> | <br /> | ||
<tanbox> | <tanbox> | ||
| − | + | :Note that the amplitude is not 5 Volts, but a lower voltage. | |
| − | : | ||
</tanbox> | </tanbox> | ||
<br /> | <br /> | ||
| Line 95: | Line 91: | ||
* Connect Probe 2 to Test Point 3 | * Connect Probe 2 to Test Point 3 | ||
* Autoset | * Autoset | ||
| − | * Press on 2 to bring Waveform 2 on the screen. | + | * Press on the ''blue'' '''2''' button to bring Waveform 2 on the screen. |
* Notice that Waveform 1 (yellow) appears very clearly, but Waveform 2 does not. | * Notice that Waveform 1 (yellow) appears very clearly, but Waveform 2 does not. | ||
* This is because Waveform 1 is faster than Waveform 2, and the scope by default synchronizes itself to the signal on Probe 1. | * This is because Waveform 1 is faster than Waveform 2, and the scope by default synchronizes itself to the signal on Probe 1. | ||
| − | == | + | <br /> |
| + | ==Solution for Getting Stable Images of Different Waveforms== | ||
* To get a better picture of what is going on, we need to take ''snapshots'' of the waveforms with the '''single''' button, while playing with the '''Scale''' button. | * To get a better picture of what is going on, we need to take ''snapshots'' of the waveforms with the '''single''' button, while playing with the '''Scale''' button. | ||
* Go ahead, change the scale a bit and press '''Single'''. Repeat a few times until you feel you have captured the repeating nature of both waveforms. | * Go ahead, change the scale a bit and press '''Single'''. Repeat a few times until you feel you have captured the repeating nature of both waveforms. | ||
| − | |||
| − | |||
| − | |||
| − | |||
| − | |||
| − | |||
| − | |||
| − | |||
<br /> | <br /> | ||
| Line 128: | Line 117: | ||
==Discover!== | ==Discover!== | ||
| − | * Figure out how to save a waveform to your USB stick! | + | * Figure out how to save a waveform to your USB stick! (Hints: the saving of waveforms to images on the USB stick is controlled from the '''Save/Recall''' buttons at the bottom of the face of the scope. Use the menu, use the select button, and save...) |
| + | * The image below gives you an idea of the type of waveform you can capture. The images are typically labeled '''tek00000.png''', '''tek00001.png''', '''tek00002.png''', etc... | ||
| + | <br /> | ||
| + | [[Image:TektronixWaveformExample.png|center|550px]] | ||
| + | <br /> | ||
| + | <br /> | ||
| + | <br /> | ||
| + | <br /> | ||
| + | <br /> | ||
Latest revision as of 14:04, 16 February 2016
--D. Thiebaut (talk) 11:49, 16 February 2016 (EST)
This lab is an introduction to the use of the Tektronix MSO3000/DPO3000 Oscilloscope.
Contents
Reference Material
- You can find annotated copies of the manual on Judy Cardell's site.
- The original manual of the scope can be found here. The good part starts on Page 29!
The Setup
- You need one of the HP signal generator boards.
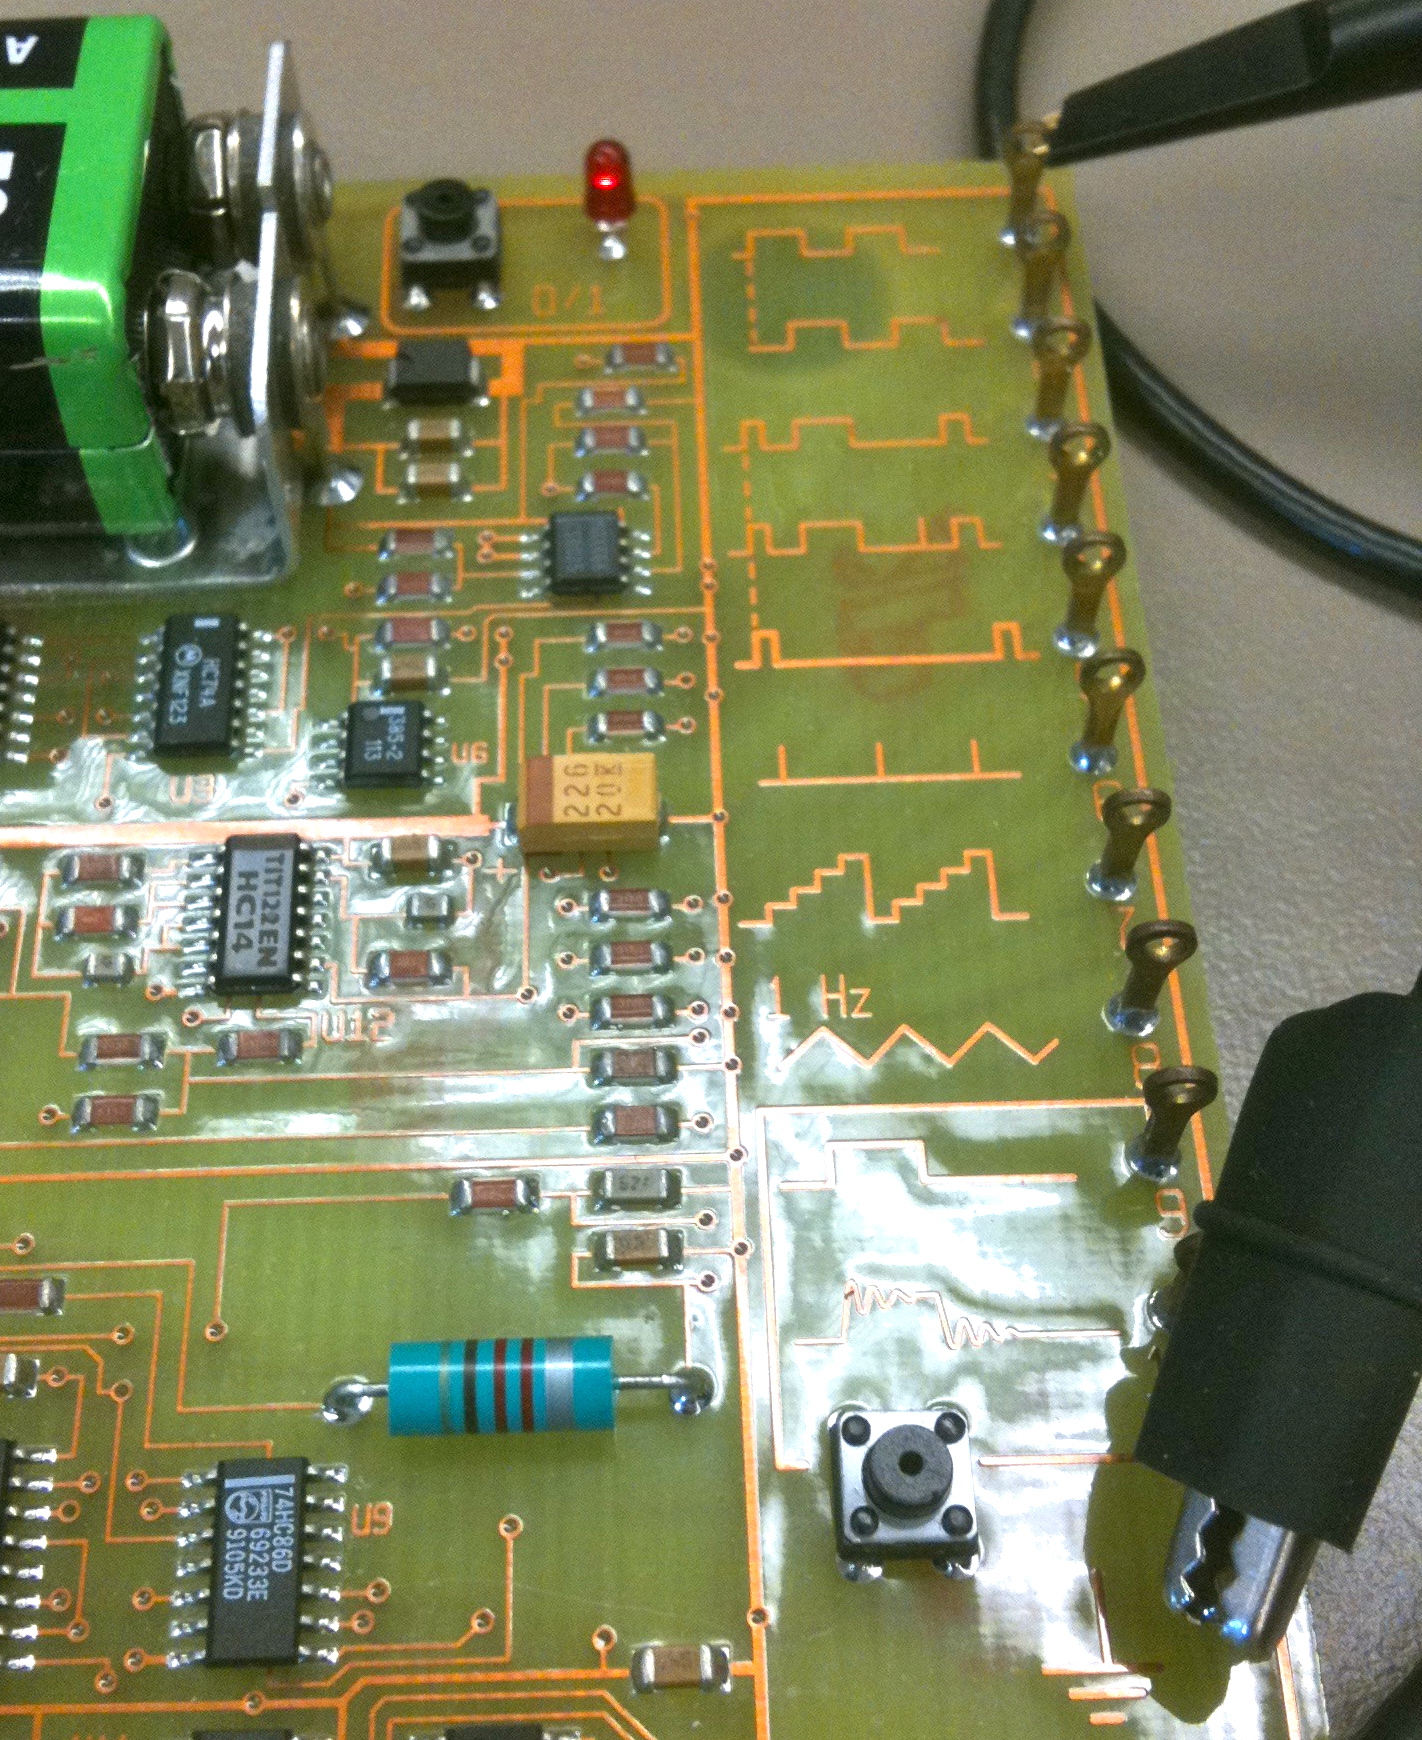
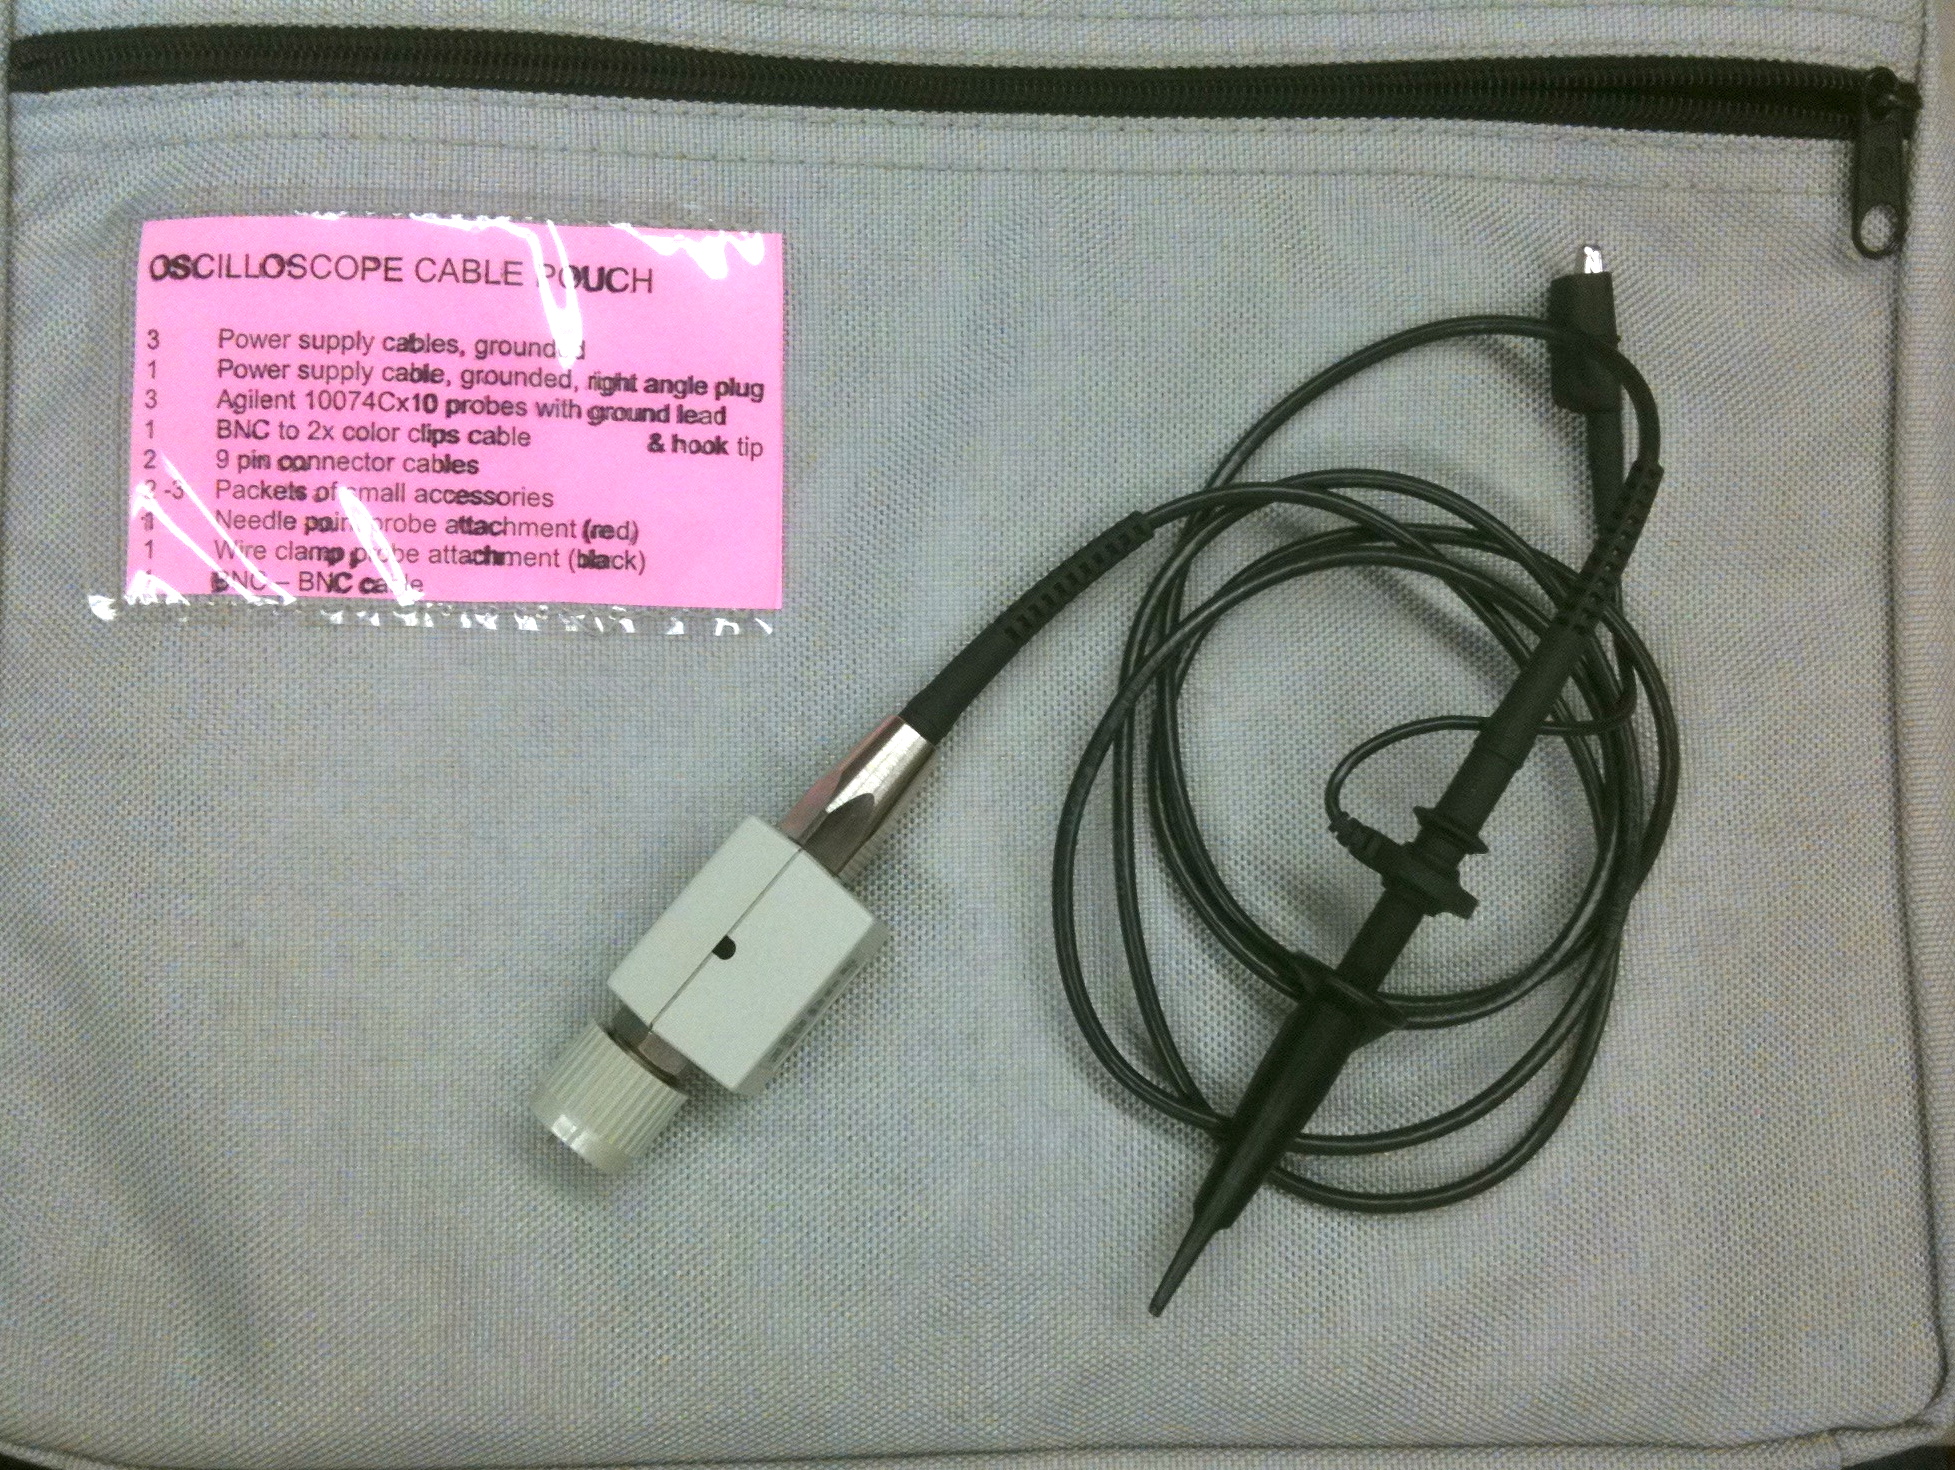
- Get a couple of probes from the equipment pouch, and connect them to the 1 and 2 inputs of the scope.
- Use colored rings to mark the probes
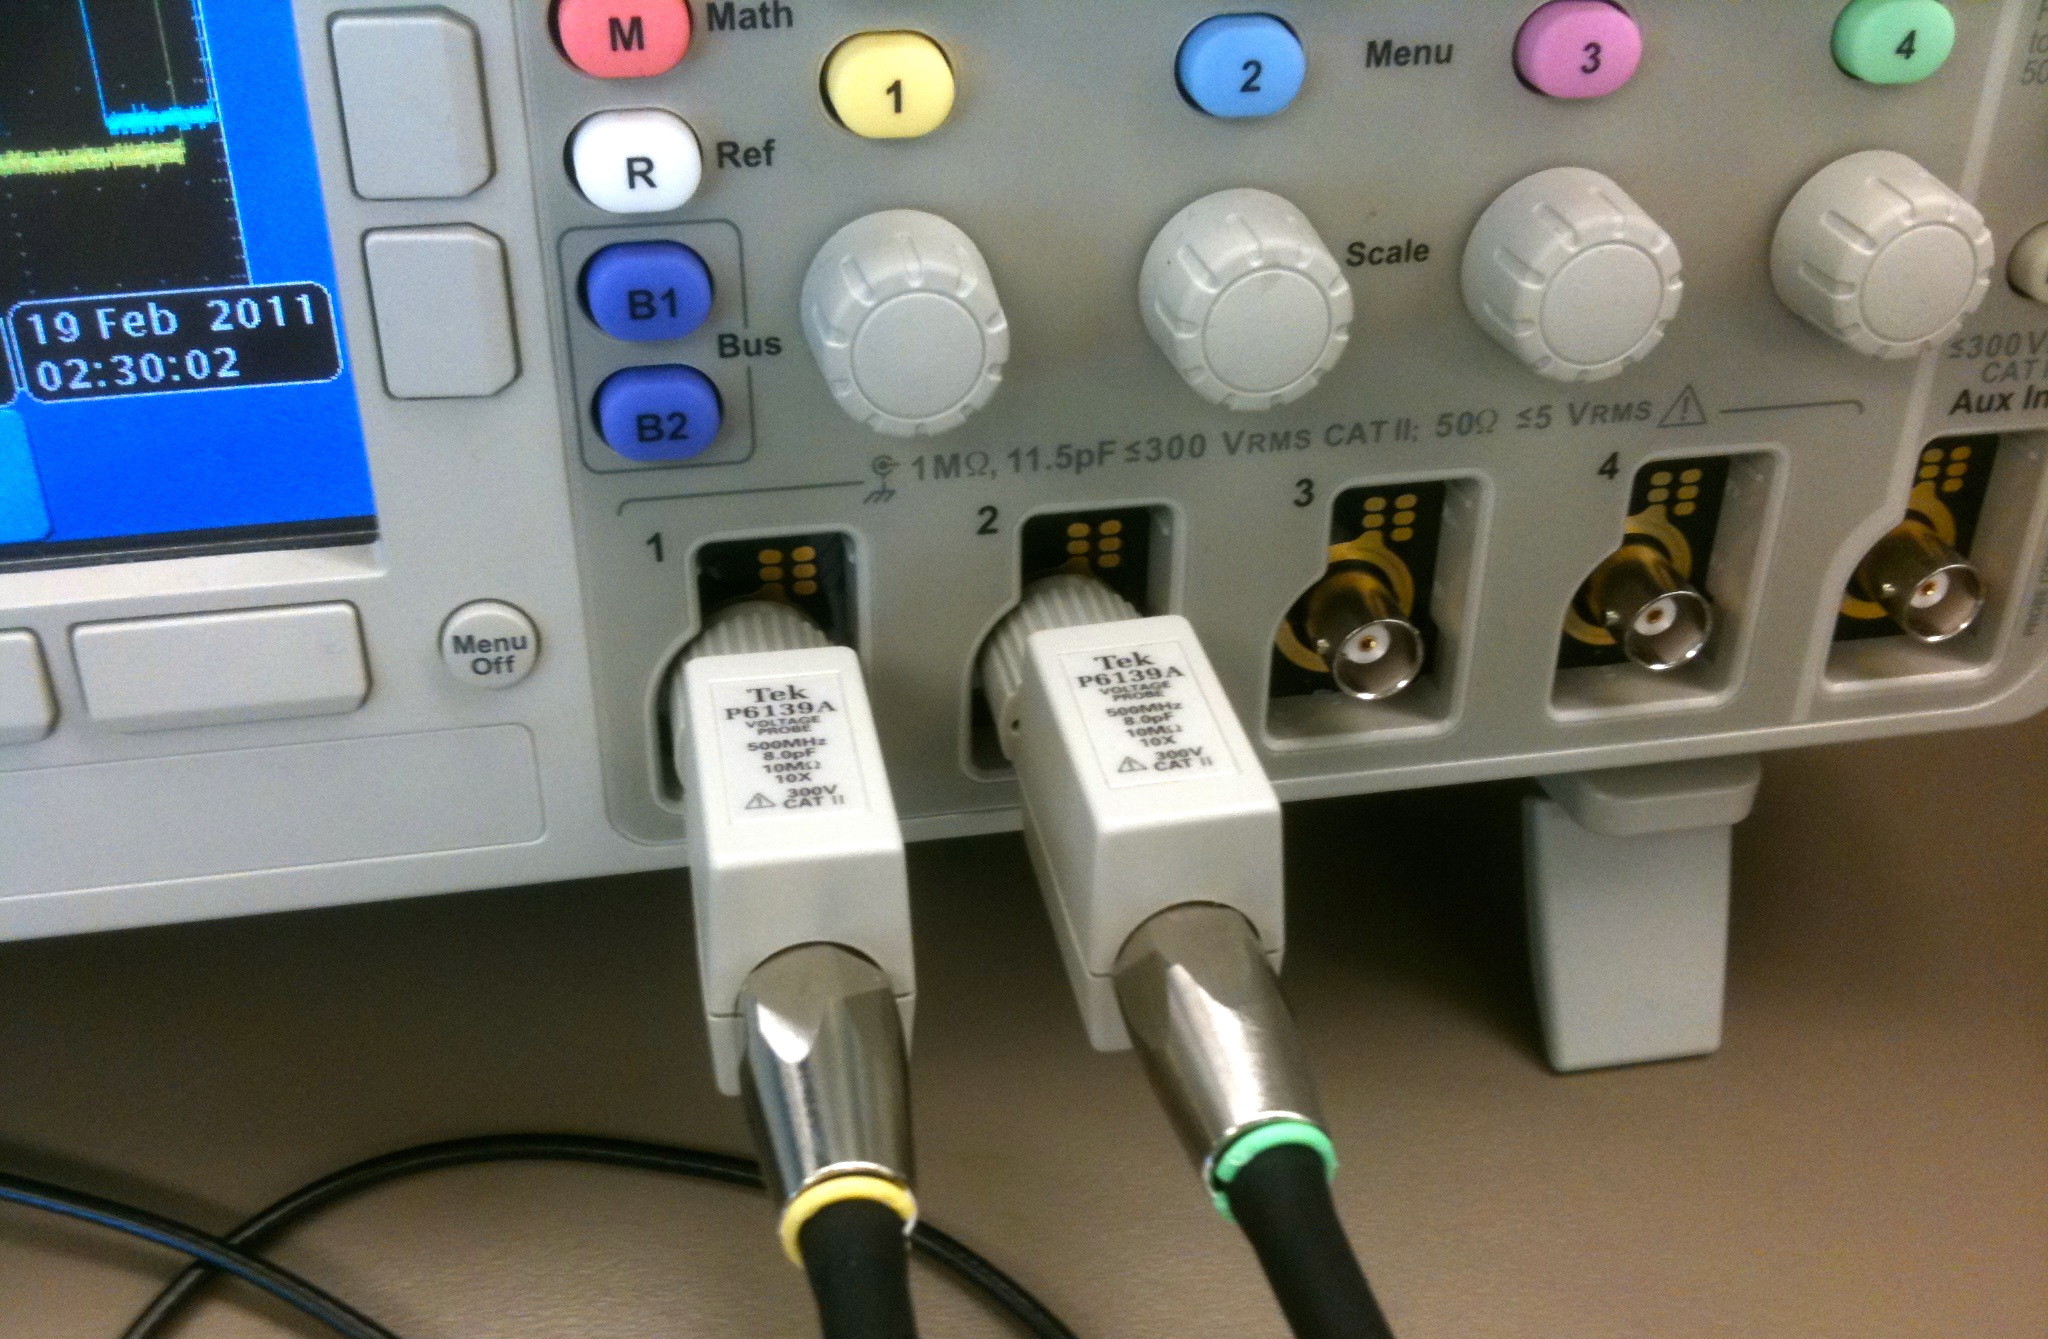
- Don't forget to connect your scope's AC cord!
Capturing one waveform
- Turn on the scope (bottom left button on face).
- Turn on the board (make sure the battery is fully engaged in its connector) by pressing on the button near the battery. A red LED should turn on.
- Connect Probe 1 to TP 1, and ground it, i.e. connect the alligator clip to the GND connector on the board.
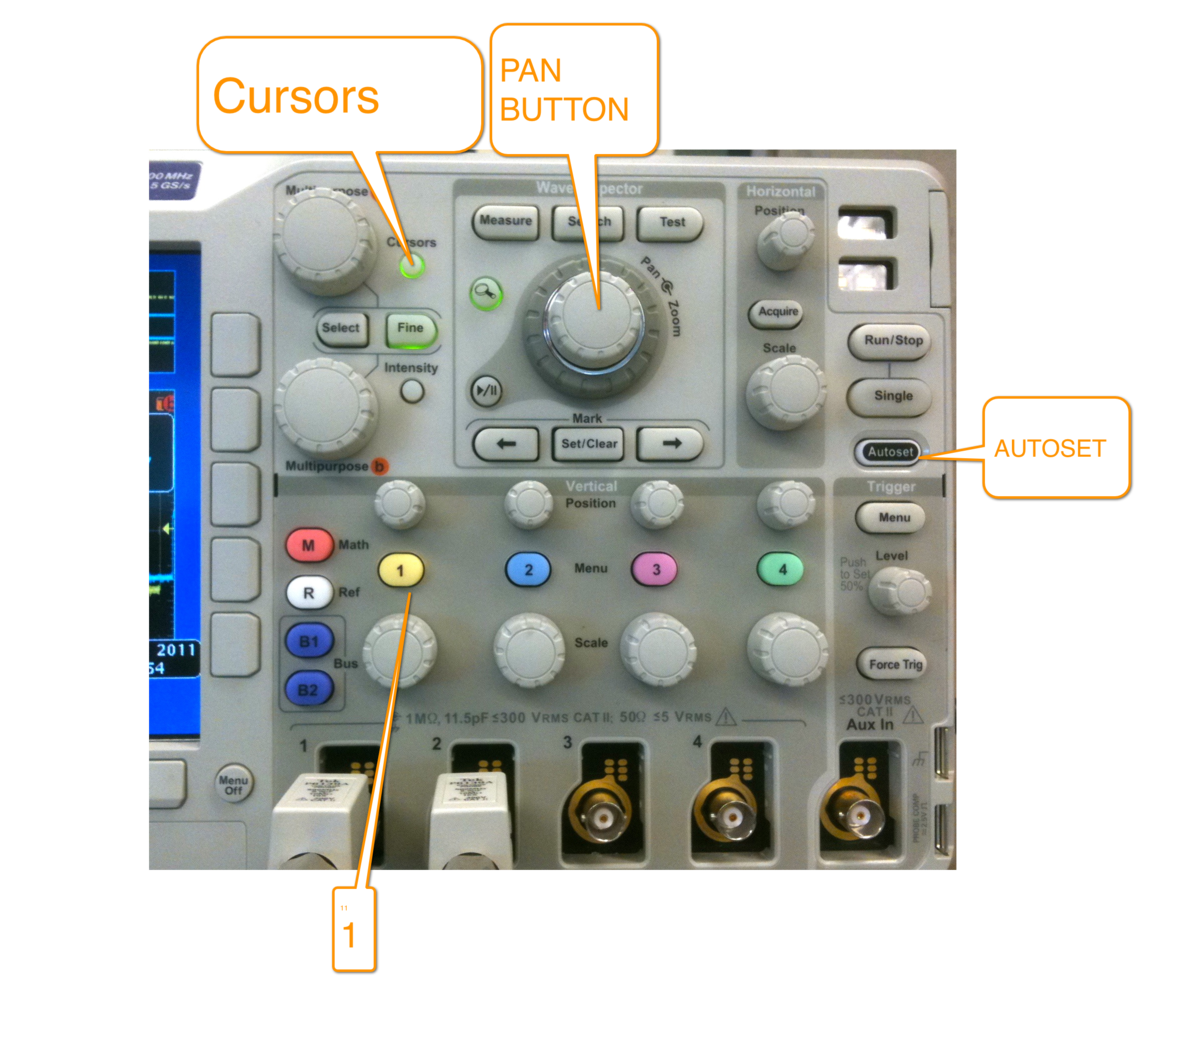
- Press the yellow 1 button right over the probe.
- Press AUTOSET (black button, middle right of face)
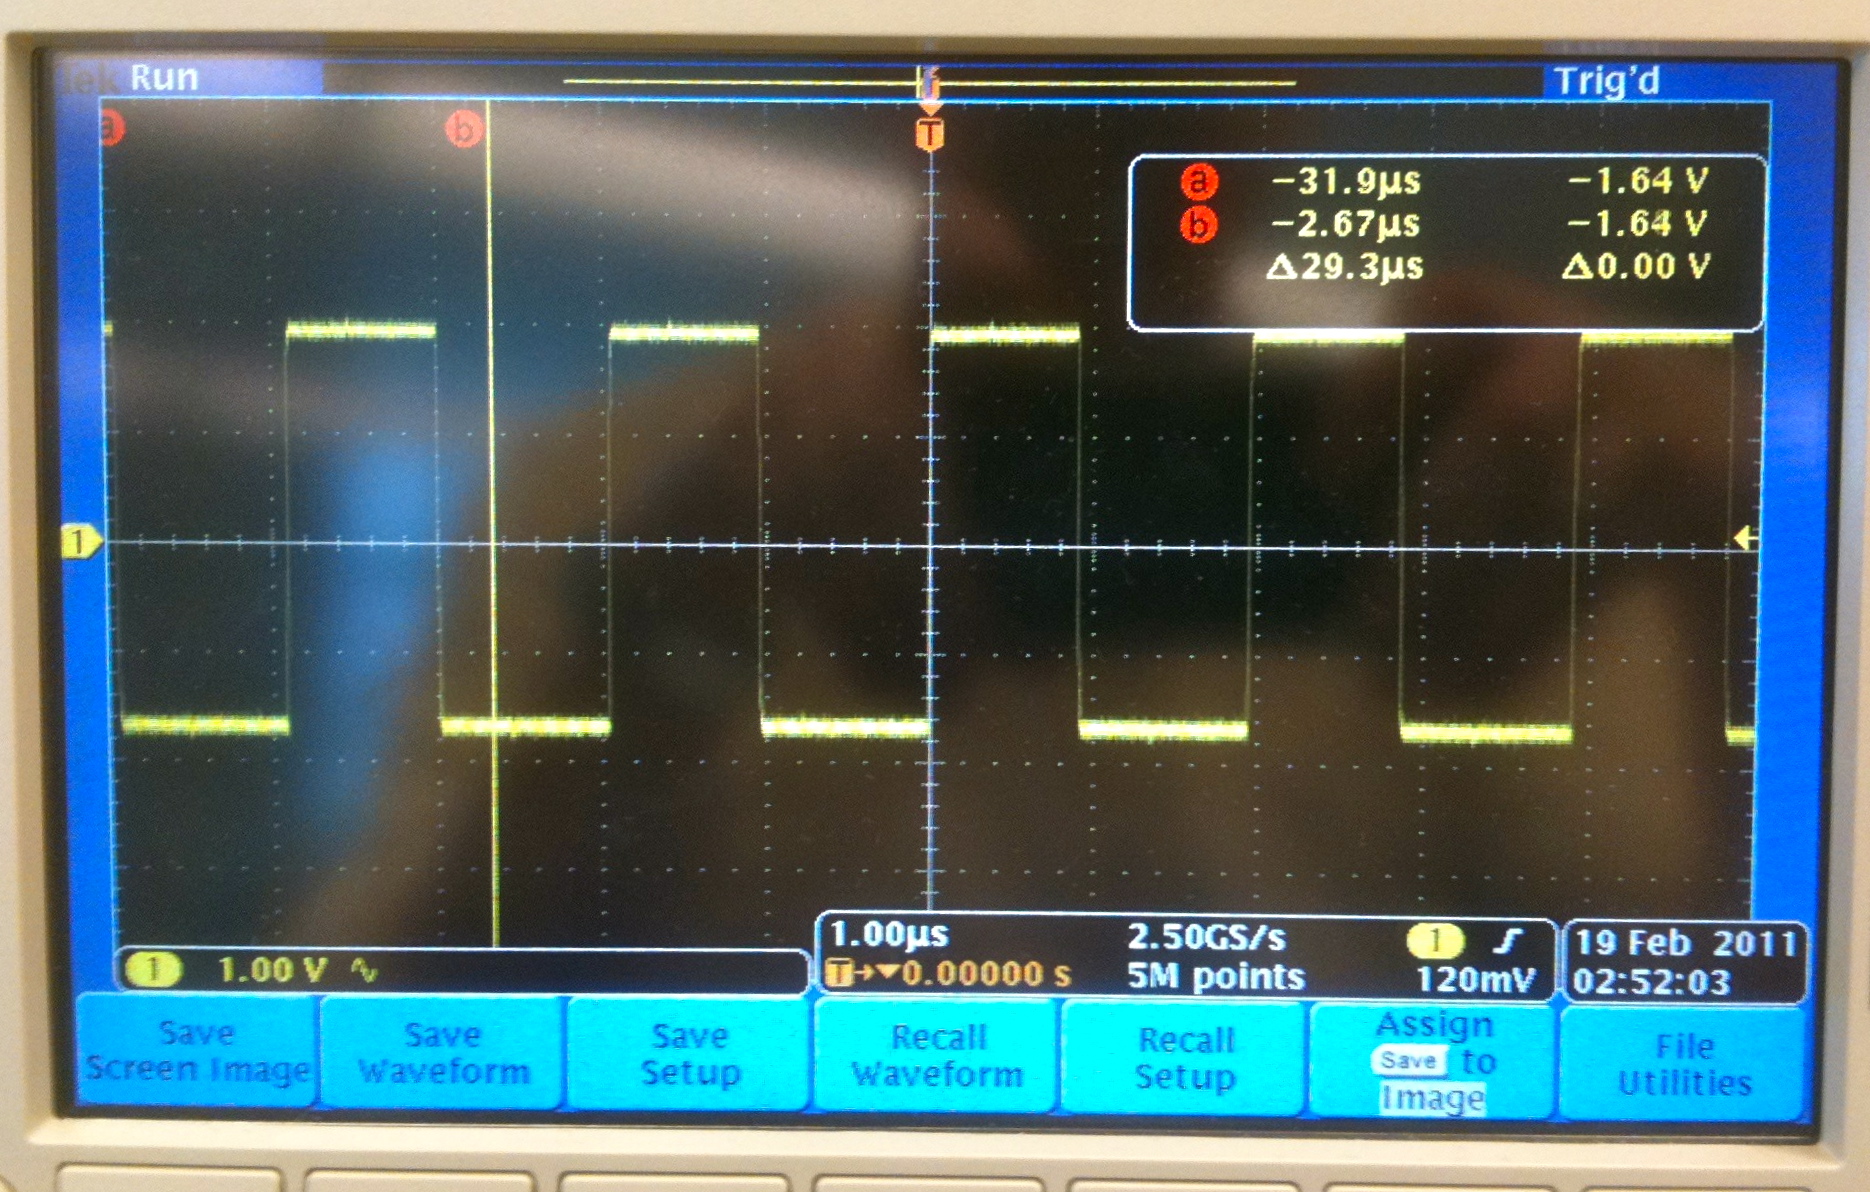
- You should get your first waveform, which is referred to as a square wave.
- Move the waveform up and down using the two buttons around the yellow 1 button
- Move the waveform left and right using the large pan button (top middle of the face).
- Scale the waveform and magnify or reduce it with the smaller zoom button, around the pan button.
Measuring waveforms: time and amplitude
- The scope has two horizontal cursors you can move around, as well as two vertical cursors that allow you to measure time differences (horizontally) and voltages (vertically).
- The cursors are turned On/Off by using the small Cursors button (top left of the face).
Time Measurements
- Question
- What is the length of one period of the signal? What is its frequency?
To answer this question:
- Move the 2 vertical cursors to measure a full period of the signal. Report the time you measure.
- Click on Measure (center top), which will bring in a menu at the bottom of the screen.
- Click on Configure Cursors and set the cursor mode to display Hz instead of seconds. Click on Configure Cursors one more time to remove the menus from the screen.
- What is the frequency reported by the scope? Is it 1/period?
Voltage Measurements
- Question
- What is the amplitude of the waveform in Volts?
To answer this question:
- Click on Cursors another time to control both horizontal and vertical cursors
- Use the Select button to switch between horizontal and vertical cursors
- Use the Multipurpose a and Multipurpose b buttons to move the cursors.
- Measure the amplitude, in volts.
- Note that the amplitude is not 5 Volts, but a lower voltage.
Capturing 2 Waveforms
- Connect Probe 2 to Test Point 3
- Autoset
- Press on the blue 2 button to bring Waveform 2 on the screen.
- Notice that Waveform 1 (yellow) appears very clearly, but Waveform 2 does not.
- This is because Waveform 1 is faster than Waveform 2, and the scope by default synchronizes itself to the signal on Probe 1.
Solution for Getting Stable Images of Different Waveforms
- To get a better picture of what is going on, we need to take snapshots of the waveforms with the single button, while playing with the Scale button.
- Go ahead, change the scale a bit and press Single. Repeat a few times until you feel you have captured the repeating nature of both waveforms.
- Question
- What is the frequency of Waveform 2 (in blue)?
Exercises
Practice!
- Get proficient at using the scope and redo the experiments above with two new waveforms: Waveforms 2 and 5.
- In particular, learn how to quickly
- measure the frequency
- measure the time difference between two points
- synchronize the two waveforms, so that you have a clear image of both, without overlapping parts
- capture the image to your USB stick.
Discover!
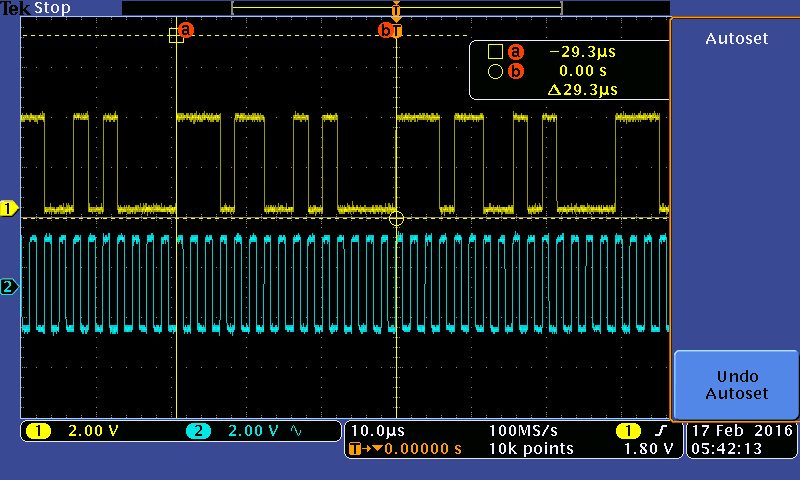
- Figure out how to save a waveform to your USB stick! (Hints: the saving of waveforms to images on the USB stick is controlled from the Save/Recall buttons at the bottom of the face of the scope. Use the menu, use the select button, and save...)
- The image below gives you an idea of the type of waveform you can capture. The images are typically labeled tek00000.png, tek00001.png, tek00002.png, etc...
