Difference between revisions of "CSC270 Lab 8 2012"
(→Part 1) |
(→Part 2) |
||
| (7 intermediate revisions by the same user not shown) | |||
| Line 3: | Line 3: | ||
| − | + | <bluebox> | |
The goal for this lab is to take the endless loop program you had to write for today, assemble it and enter its code in the 6811 trainer, and use the scope to see its execution, ''live''! | The goal for this lab is to take the endless loop program you had to write for today, assemble it and enter its code in the 6811 trainer, and use the scope to see its execution, ''live''! | ||
| + | </bluebox> | ||
| + | <br /> | ||
| + | <center>[[Image:Tliu_TimingDiagram.png|500px]]<br />(Picture taken by Tiffany Liu, 2011)</center> | ||
| + | <br /> | ||
==Part 1== | ==Part 1== | ||
| Line 13: | Line 17: | ||
addr data addr nybble data nybble | addr data addr nybble data nybble | ||
| + | |||
xxxx xx xxxx xxxx | xxxx xx xxxx xxxx | ||
000A 1B 1010 1011 | 000A 1B 1010 1011 | ||
| Line 19: | Line 24: | ||
| + | :The reason you want to display the binary information is that you'll have to pick one of the bits of the address or of the data bus to show on the scope, and the bit that has the most ''recognizable'' pattern should be the one you want to pick (i.e. you don't want to pick a bit that would be always 0 or always 1). | ||
* Create a cycle by cycle description of the execution of the instruction. Use one line per cycle, and use text, rather than a drawing. | * Create a cycle by cycle description of the execution of the instruction. Use one line per cycle, and use text, rather than a drawing. | ||
| Line 29: | Line 35: | ||
==Part 2== | ==Part 2== | ||
| − | * Put one probe on the E clock signal (use the handout to spot the different signals on the trainer breadboard area). | + | * Put one probe on the '''E''' clock signal (use the handout to spot the different signals on the trainer breadboard area). |
| − | * Put the other probe on the LIR signal, which is the complement of the 6811 LIR signal. The 6811 Reference Manual defines the LIR as follows: | + | * Put the other probe on the LIR' signal, which is the complement of the 6811 LIR signal. The 6811 Reference Manual defines the LIR as follows: |
::''LIR': The LIR' (active low) pin goes to an active low during the first E-clock cycle of each instruction and<br/>remains low for the duration of that cycle (opcode fetch). <br />Some MC6811 opcocdes are two consecutive bytes long [...]. For these instruction LIR' goes low for only the first (prebyte) opcode byte fetch. | ::''LIR': The LIR' (active low) pin goes to an active low during the first E-clock cycle of each instruction and<br/>remains low for the duration of that cycle (opcode fetch). <br />Some MC6811 opcocdes are two consecutive bytes long [...]. For these instruction LIR' goes low for only the first (prebyte) opcode byte fetch. | ||
* Take a picture, and be the sleuth! Describe what you are observing. | * Take a picture, and be the sleuth! Describe what you are observing. | ||
; Question | ; Question | ||
: What is the average number of instructions executed by the 6811 over time. Express your result in MIPS (million instructions per seconds)? | : What is the average number of instructions executed by the 6811 over time. Express your result in MIPS (million instructions per seconds)? | ||
| + | |||
| + | :The table below taken from [http://en.wikipedia.org/wiki/Instructions_per_second Wikipedia's page on Instructions Per Second] shows the 2016 entries for various processors and their best performance in MIPS. How does the 6811 compare? | ||
| + | <br /> | ||
| + | [[Image:2011Mips.png|750px]] | ||
| + | <br /> | ||
==Part 3== | ==Part 3== | ||
| Line 55: | Line 66: | ||
<br /> | <br /> | ||
<br /> | <br /> | ||
| + | =Graph Paper= | ||
| + | A sheet of graph paper or two might be useful for this lab! :-) | ||
| + | <center> | ||
| + | [[Image:GraphPaper.png|600px]] | ||
| + | </center> | ||
<br /> | <br /> | ||
<br /> | <br /> | ||
Latest revision as of 15:20, 29 March 2016
--D. Thiebaut 13:13, 3 April 2012 (EDT)
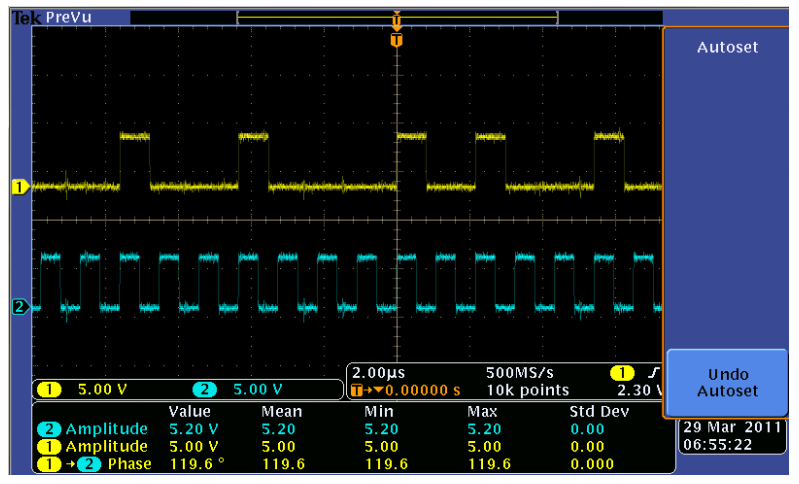
The goal for this lab is to take the endless loop program you had to write for today, assemble it and enter its code in the 6811 trainer, and use the scope to see its execution, live!

(Picture taken by Tiffany Liu, 2011)
Part 1
- Assemble your code by hand
- Write down the hexadecimal address and data values in hex.
- Write down each address and each byte, one pair per line, and write down the last nybble of each one in binary. See the example below for guidance:
 addr data   addr nybble  data nybble

 xxxx xx       xxxx         xxxx
 000A 1B       1010         1011
 xxxx xx       xxxx         xxxx
 xxxx xx       xxxx         xxxx
- The reason you want to display the binary information is that you'll have to pick one of the bits of the address or of the data bus to show on the scope, and the bit that has the most recognizable pattern should be the one you want to pick (i.e. you don't want to pick a bit that would be always 0 or always 1).
- Create a cycle by cycle description of the execution of the instruction. Use one line per cycle, and use text, rather than a drawing.
- Enter the opcodes in the trainer.
- Execute the program
- Question
- Why is the trainer display blank when the program runs?
Part 2
- Put one probe on the E clock signal (use the handout to spot the different signals on the trainer breadboard area).
- Put the other probe on the LIR' signal, which is the complement of the 6811 LIR signal. The 6811 Reference Manual defines the LIR as follows:
- LIR': The LIR' (active low) pin goes to an active low during the first E-clock cycle of each instruction and
remains low for the duration of that cycle (opcode fetch).
Some MC6811 opcocdes are two consecutive bytes long [...]. For these instruction LIR' goes low for only the first (prebyte) opcode byte fetch.
- LIR': The LIR' (active low) pin goes to an active low during the first E-clock cycle of each instruction and
- Take a picture, and be the sleuth! Describe what you are observing.
- Question
- What is the average number of instructions executed by the 6811 over time. Express your result in MIPS (million instructions per seconds)?
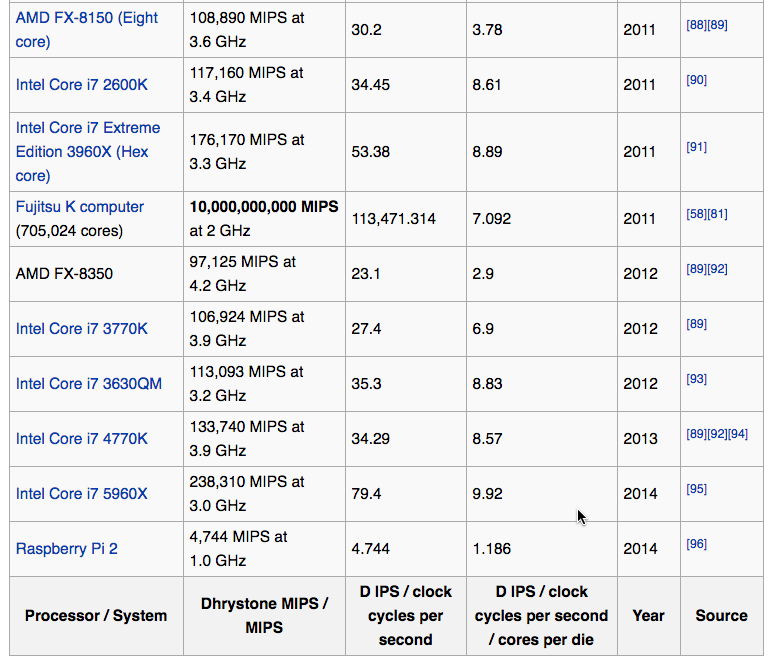
- The table below taken from Wikipedia's page on Instructions Per Second shows the 2016 entries for various processors and their best performance in MIPS. How does the 6811 compare?
Part 3
- Connect a third probe to the R/W' (read/write) signal.
- Similarly, be the sleuth and explain what you observe.
- Question
- What is the average number of times your loop runs, in one second?
Part 4
- Connect a fourth probe to one of the address bus lines. Pick one that will give you the most information about what is going on.
- Similarly, be the sleuth and explain what you observe on the scope.
Part 5
- Disconnect one of the probes (figure out which signal is least important for this part), and connect it to one of the bits of the data bus. Again, pick the bit that carries most information and will be able to best illustrate what is going on.
- Question
- You should notice that in one cycle the data bit you picked is not stable, and keeps showing 1 and 0, seemingly simultaneously. Why is this happening?
Graph Paper
A sheet of graph paper or two might be useful for this lab! :-)

