Difference between revisions of "Debugging with Eclipse: A Quick Introduction"
(→Single Step) |
(→Exercise) |
||
| (12 intermediate revisions by the same user not shown) | |||
| Line 9: | Line 9: | ||
<br /> | <br /> | ||
<br /> | <br /> | ||
| − | =Getting Started= | + | =Part 1: Getting Started with the Eclipse Debugger= |
<br /> | <br /> | ||
* Open Eclipse | * Open Eclipse | ||
| Line 118: | Line 118: | ||
* As you single step some more you will see that '''p''' will appear, then disappear, as the loop is progressing. That's the life span of local variables in blocks! Make sure to open-up the '''p''' by clicking the triangle next to it, in the '''Variables''' window, and see what pair points to. | * As you single step some more you will see that '''p''' will appear, then disappear, as the loop is progressing. That's the life span of local variables in blocks! Make sure to open-up the '''p''' by clicking the triangle next to it, in the '''Variables''' window, and see what pair points to. | ||
<br /> | <br /> | ||
| + | ==Finish Running the Program== | ||
| + | <br /> | ||
| + | * When you are satisfied that you have understood what you were single-stepping over, you can make the program resume going full speed. For this, just click the orange rectangle + green triangle icon (labeled '''Resume (F8)''') on the top bar. This will run the program full speed until its normal end. | ||
| + | * If you do not want to resume the program, then kill it, using the red square. A good rule of thumb is that if a red square is showing on the Eclipse window, something is running or temporarily stopped. If you do not need it, then stop it by clicking on the red square! | ||
| + | <br /> | ||
| + | <br /> | ||
| + | ---- | ||
| + | <br /> | ||
| + | <br /> | ||
| + | <tanbox> | ||
| + | That's it; you have the basics for debugging program. Remember to always set a breakpoint first. Then run/debug the program; this will make it go full-speed until the break point. | ||
| + | </tanbox> | ||
| + | <br /> | ||
| + | <br /> | ||
| + | |||
| + | =Part 2: Conditional Breakpoints= | ||
| + | <br /> | ||
| + | * Assume that you have a program that does a lot of computation in a loop before things start getting "strange," and you don't want to have to single-step through 100 iterations of a loop before you start reaching the place of interest in the computation. | ||
| + | |||
| + | * In this part we see how to set a breakpoint that becomes active only when some condition is met. | ||
| + | |||
| + | * Here's the program we're going to play with: | ||
| + | <br /> | ||
| + | ::<source lang="java"> | ||
| + | // DebugDemo2.java | ||
| + | // D. Thiebaut | ||
| + | public class DebugDemo2 { | ||
| + | |||
| + | public static void main(String[] args) { | ||
| + | long Fibn, Fibn_1 = 1, Fibn_2 = 1; | ||
| + | long[] fib = new long[200]; | ||
| + | fib[0] = fib[1] = 1; | ||
| + | |||
| + | for ( int i=2; i < fib.length; i++ ) { | ||
| + | Fibn = Fibn_1 + Fibn_2; | ||
| + | fib[i] = Fibn; | ||
| + | Fibn_2 = Fibn_1; | ||
| + | Fibn_1 = Fibn; | ||
| + | } | ||
| + | } | ||
| + | } | ||
| + | </source> | ||
| + | <br /> | ||
| + | * We've seen this program before. It computes Fibonacci terms in a loop and stores them in an array. The problem with this code is that Fibonacci terms get large very fast, and at some point they overflow the '''long''' integer they are stored in. | ||
| + | * Just to make sure you understand the problem, just add a System.out.println( Fibn ) statement at the bottom of your loop, and verify that, indeed, Fibn becomes negative at some point. | ||
| + | * Did you see the negative numbers? Good; now remove the print statement! | ||
| + | * This program is simple enough that using print statements is enough to figure out where the bug is. In more complicated programs, though, might generate too much information. What if the problem manifests itself after a loop has iterated a million times? | ||
| + | <br /> | ||
| + | ==Setting a Conditional Breakpoint== | ||
| + | <br /> | ||
| + | * Let's make the program stop when it reaches Line 11, and '''Fibn''' is negative: | ||
| + | * Right/Control click on Line 11 and set a breakpoint, as you did in Part 1. | ||
| + | * Right/Control click on Line 11 again, and this time pick '''Breakpoint Properties''' | ||
| + | * Click '''Conditional''', '''Suspend thread''', '''Suspend when true''', and enter the following expression in the window: | ||
| + | |||
| + | Fibn < 0 | ||
| + | |||
| + | :indicating that we want the breakpoint to activate, i.e. the program to stop, when (Fibn < 0) becomes true. | ||
| + | <br /> | ||
| + | <center>[[Image:EclipseDebug6.png|500px ]]</center> | ||
| + | <br /> | ||
| + | * Click Ok to close the window. | ||
| + | * Click on the '''bug''' icon to run your program. | ||
| + | * If everything goes well, it will stop on Line 11 when Fibn becomes negative. | ||
| + | <br /> | ||
| + | <center>[[Image:EclipseDebug7.png|700px]]</center> | ||
| + | <br /> | ||
| + | * Observe that the state of the program when the problem occurs is fully visible: | ||
| + | ::# Fibn is indeed negative (-6246583658587674878) | ||
| + | ::# i is 92, indicating that it occurs at Iteration 92 of the loop. | ||
| + | ::# we are indeed stopped on Line 11 of main(), in DebugDemo2. | ||
| + | <br /> | ||
| + | * Click on the red square to kill the program. | ||
| + | <br /> | ||
| + | <br /> | ||
| + | =Exercise= | ||
| + | <br /> | ||
| + | * Study the code below. Pay attention to the for-loop and what it computes. | ||
| + | ::<source lang="java"> | ||
| + | import java.util.ArrayList; | ||
| + | import java.util.UUID; | ||
| + | |||
| + | |||
| + | class Triplet { | ||
| + | public String s; | ||
| + | int i, j; | ||
| + | Triplet( String ss, int ii, int jj ) { s=ss; i=ii; j=jj; } | ||
| + | public String toString() { return s+"("+i+ ", " + j + ")"; } | ||
| + | } | ||
| + | |||
| + | public class DebugDemo3 { | ||
| + | static int seed = 1111; | ||
| + | |||
| + | public static void main(String[] args) { | ||
| + | ArrayList<Triplet> A = new ArrayList<Triplet>(); | ||
| + | int x, y; | ||
| + | for ( int i=0; i<10000; i++ ) { | ||
| + | String randomString = UUID.randomUUID().toString(); | ||
| + | x = randomInt(); | ||
| + | y = randomInt(); | ||
| + | A.add( new Triplet( randomString, x, y ) ); | ||
| + | } | ||
| + | } | ||
| + | |||
| + | private static int randomInt() { | ||
| + | int x = (11 + seed * 99563) % 104729; | ||
| + | seed = (11 + x * 99563) % 104729; | ||
| + | return seed & x; | ||
| + | } | ||
| + | } | ||
| + | </source> | ||
| + | <onlydft> | ||
| + | 9900 4ee13608-4328-41a5-8fdc-46e90e771f8b(68616, -131030) | ||
| + | </onlydft> | ||
| + | * Without printing anything on the screen, figure out at what index '''i''', the loop above generates a new triplet that has 68616 for x, and -131030 for y. | ||
| + | <br /> | ||
| + | <br /> | ||
| + | <br /> | ||
| + | <br /> | ||
| + | <br /> | ||
| + | <br /> | ||
| + | <br /> | ||
| + | <br /> | ||
| + | <br /> | ||
| + | <br /> | ||
| + | <br /> | ||
| + | <br /> | ||
| + | <br /> | ||
| + | <br /> | ||
| + | <br /> | ||
| + | <br /> | ||
| + | <br /> | ||
| + | <br /> | ||
| + | <br /> | ||
| + | <br /> | ||
| + | [[Category:CSC212]][[Category:Lab]] | ||
Latest revision as of 13:52, 22 October 2014
--D. Thiebaut (talk) 10:44, 22 October 2014 (EDT)
Contents
This is a short tutorial on how to get started with the Eclipse Debugger. Mastering the debugger takes time. The purpose of this lab/tutorial is just to show you how to get started.
Part 1: Getting Started with the Eclipse Debugger
- Open Eclipse
- Create a New Java Class. Call it DebugDemo.
- Enter this code in it:
// DebugDemo.java
// D. Thiebaut
// CSC212
import java.util.ArrayList;
import java.util.Iterator;

class Pair {
	public String name;
	public int age;
	Pair( String f, int s ) { name=f; age=s; }
	public String toString() { return name+"("+age+") "; }
}

public class DebugDemo {


	public static void main(String[] args) {
                ArrayList<Pair> A = new ArrayList<Pair>();
		int increment = 3;

		A.add( new Pair( "Alice", 10 ) );
		A.add( new Pair( "Bob", 7 ) );

		Iterator<Pair> it = A.iterator();
		while ( it.hasNext() ) {
			Pair p = it.next();
			p.age += increment;
		}

		for ( int i=0; i<3; i++ ) {
			Pair p = A.get(  i );
			System.out.println( A.get( i ) );
		}
	}

}
- Run it.
- Observe what the program does. It simply creates an array of 2 pairs, containing Alice(10) and Bob(7), and modify the age of both by an increment of 3.
Go into Debugging Mode
- In the Package Explorer tab (left tab), right/control click on DebugDemo and select Debug As and Java Application.
- The windows will reorganize themselves (if not, see below):
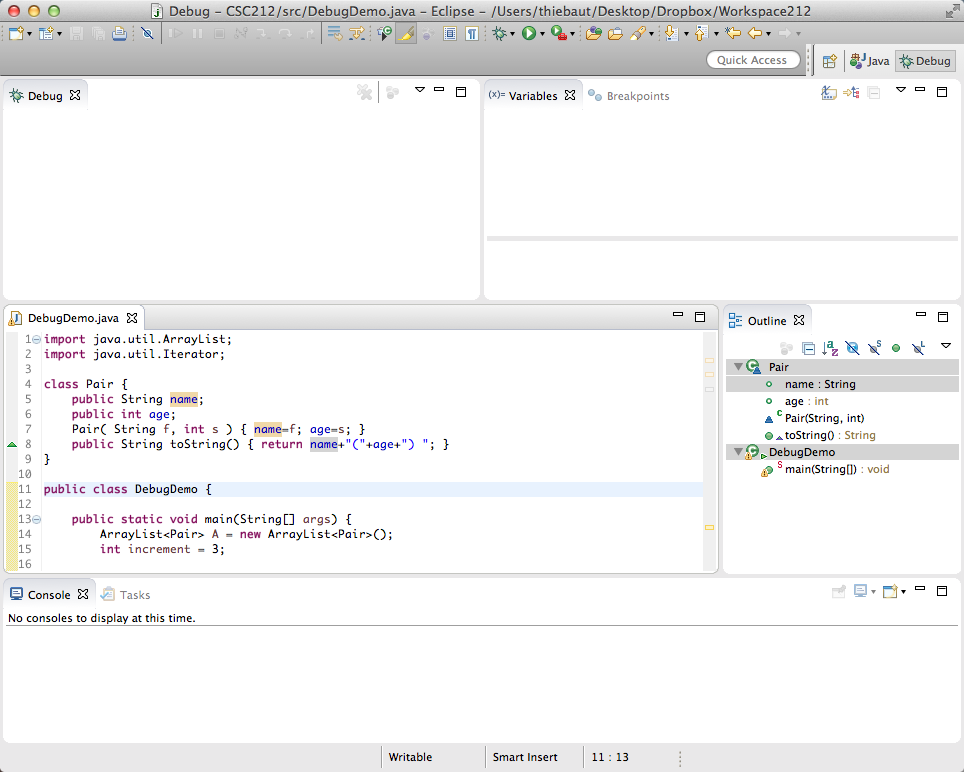
- If you do not get the window shown above, click on the little "table and plus symbol" in the top right of the window, and pick Debug in the new pop-up window :
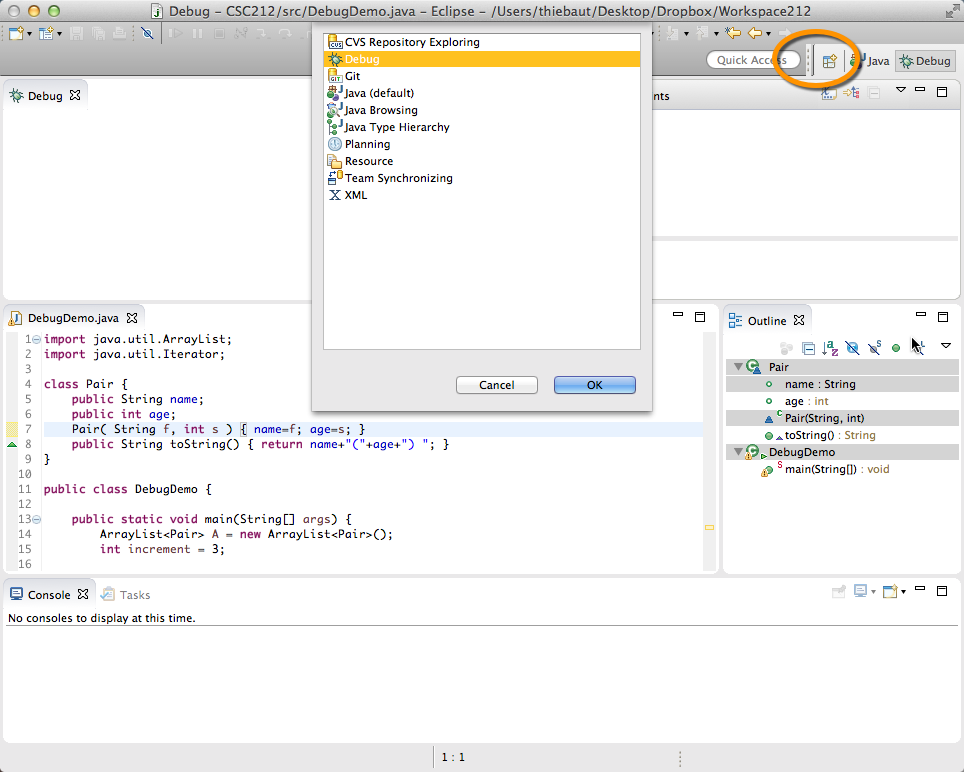
- You can switch back and forth between Java coding and debugging using the Java and Debug buttons in the top right of the Eclipse window.
Getting Ready to Debug
- One of the best method to start when debugging is to follow this 3-step approach:
- Set a breakpoint on a line of code where you want to start observing what your program is doing.
- Run your program full speed. As soon as the computer reaches the breakpoint, it will stop (but not exit), and wait for your instructions.
- Single-step your program, observing how the different variables and data structures evolve.
Set A Breakpoint
- We will want to start watching our program from the beginning of main, when the program puts the first pair in the array.
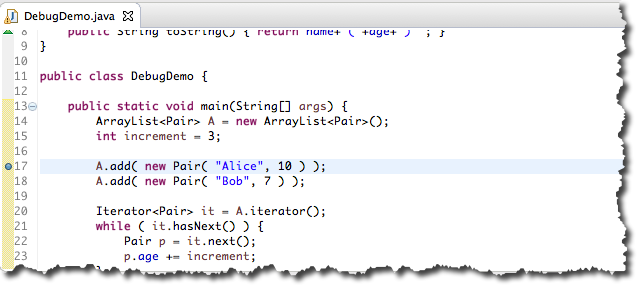
- Put your cursor in the 17 in the left margin of A.add( new Pair( "Alice", 10 ) );
- Right/Control click on 17.
- Select Toggle Breakpoint. A blue dot should appear left of 17.
Run the Program to the Breakpoint
- Now that you have a breakpoint, you can run the program; it will automatically go through the initialization, and will stop on the breakpoint. It will not execute line 17, though. It will simply break on it.
- Click on the bug, next to the green circle with white arrow to start debugging the program.
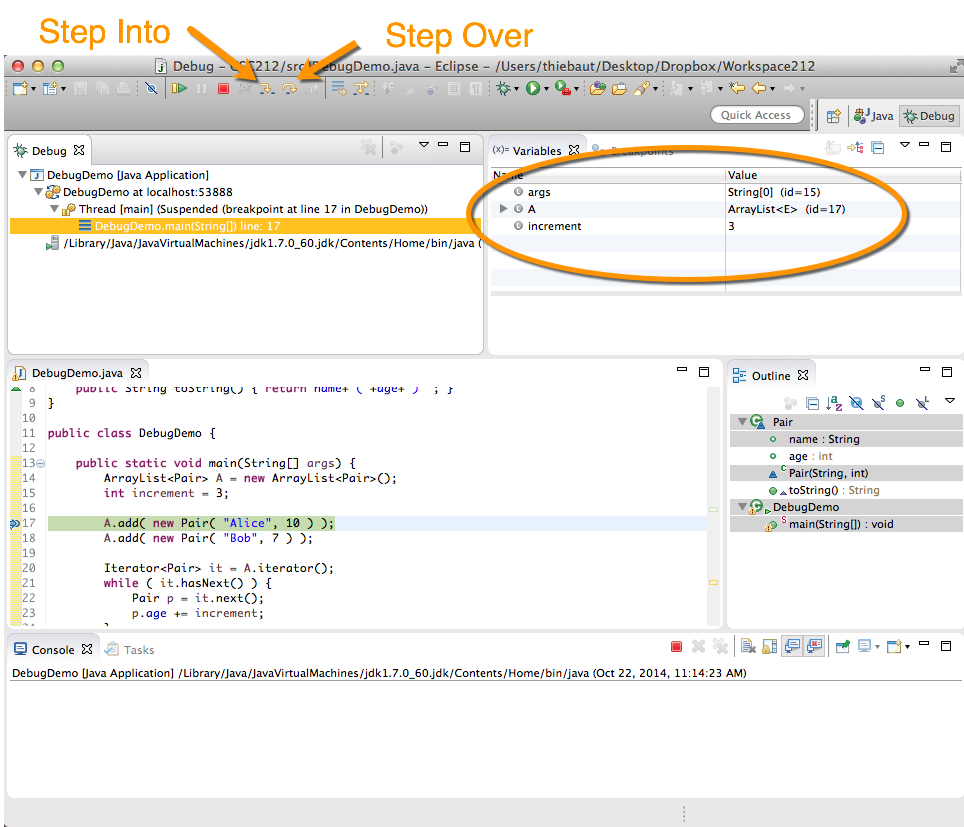
- Note several new pieces of information that have appeared
- The top-right tab called Variables shows you the local variables of the block you are in. Note that you see 3 variables, including args, A, and increment, along with their values.
- The top menu has 2 new active buttons, one for stepping into lines of code, one for stepping over lines of code. The difference is that Step into will take you inside functions that appear in the line of code you're debugging. Step Over will run the functions appearing in the current code line full speed. Most of the time, we want to use Step Over.
- Step Into an also be activated by the F5 key.
- Step Over by the F6 key.
Single Step
- Click Step Over or F6 once.
- Note that Line 18 is now highlighted. It is the next line Eclipse is ready to execute. It has finished Line 17.
- Click on the triangle next to the array A in the top right Variables window to open it.
- Click on the triangle next to elementData to see the elements of A.
- Click on the triangle nexxt to Element [0].
- Do you see Alice and her age of 10?
- You have just verified that Line 17 of your program added (Alice,10) to the array A.
- Click Step Over one more time. Verify that (Bob, 7) was added to A. Observe that all objects have an id. It makes it easy to identify things such as pairs, or strings.
- Click Step Over a few times until you reach Line 23. Observe that p points to a pair object, containing Alice first, then Bob (once you have stepped over a few more times).
- Single step some more until you reach Line 27.
- Observe that the variable i has appeared in the Variables window (top-right).
- As you single step some more you will see that p will appear, then disappear, as the loop is progressing. That's the life span of local variables in blocks! Make sure to open-up the p by clicking the triangle next to it, in the Variables window, and see what pair points to.
Finish Running the Program
- When you are satisfied that you have understood what you were single-stepping over, you can make the program resume going full speed. For this, just click the orange rectangle + green triangle icon (labeled Resume (F8)) on the top bar. This will run the program full speed until its normal end.
- If you do not want to resume the program, then kill it, using the red square. A good rule of thumb is that if a red square is showing on the Eclipse window, something is running or temporarily stopped. If you do not need it, then stop it by clicking on the red square!
That's it; you have the basics for debugging program. Remember to always set a breakpoint first. Then run/debug the program; this will make it go full-speed until the break point.
Part 2: Conditional Breakpoints
- Assume that you have a program that does a lot of computation in a loop before things start getting "strange," and you don't want to have to single-step through 100 iterations of a loop before you start reaching the place of interest in the computation.
- In this part we see how to set a breakpoint that becomes active only when some condition is met.
- Here's the program we're going to play with:
// DebugDemo2.java
// D. Thiebaut
public class DebugDemo2 {

	public static void main(String[] args) {
		long Fibn, Fibn_1 = 1, Fibn_2 = 1;
		long[] fib = new long[200];
		fib[0] = fib[1] = 1;

		for ( int i=2; i < fib.length; i++ ) {
			Fibn = Fibn_1 + Fibn_2;
			fib[i] = Fibn;
			Fibn_2 = Fibn_1;
			Fibn_1 = Fibn;
		}
	}
}
- We've seen this program before. It computes Fibonacci terms in a loop and stores them in an array. The problem with this code is that Fibonacci terms get large very fast, and at some point they overflow the long integer they are stored in.
- Just to make sure you understand the problem, just add a System.out.println( Fibn ) statement at the bottom of your loop, and verify that, indeed, Fibn becomes negative at some point.
- Did you see the negative numbers? Good; now remove the print statement!
- This program is simple enough that using print statements is enough to figure out where the bug is. In more complicated programs, though, might generate too much information. What if the problem manifests itself after a loop has iterated a million times?
Setting a Conditional Breakpoint
- Let's make the program stop when it reaches Line 11, and Fibn is negative:
- Right/Control click on Line 11 and set a breakpoint, as you did in Part 1.
- Right/Control click on Line 11 again, and this time pick Breakpoint Properties
- Click Conditional, Suspend thread, Suspend when true, and enter the following expression in the window:
Fibn < 0
- indicating that we want the breakpoint to activate, i.e. the program to stop, when (Fibn < 0) becomes true.
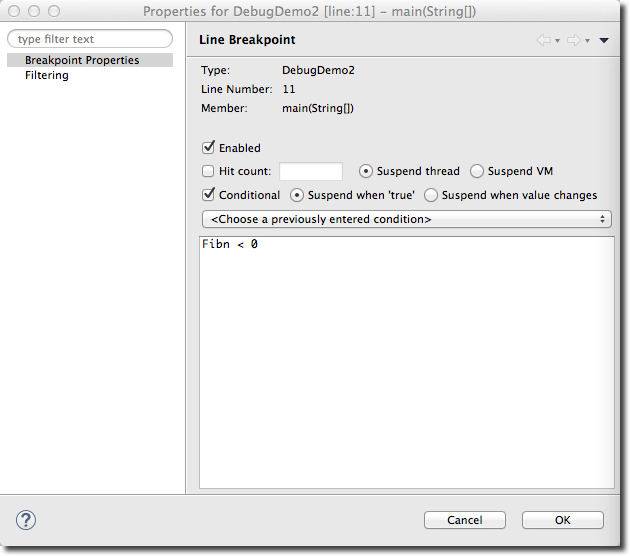
- Click Ok to close the window.
- Click on the bug icon to run your program.
- If everything goes well, it will stop on Line 11 when Fibn becomes negative.
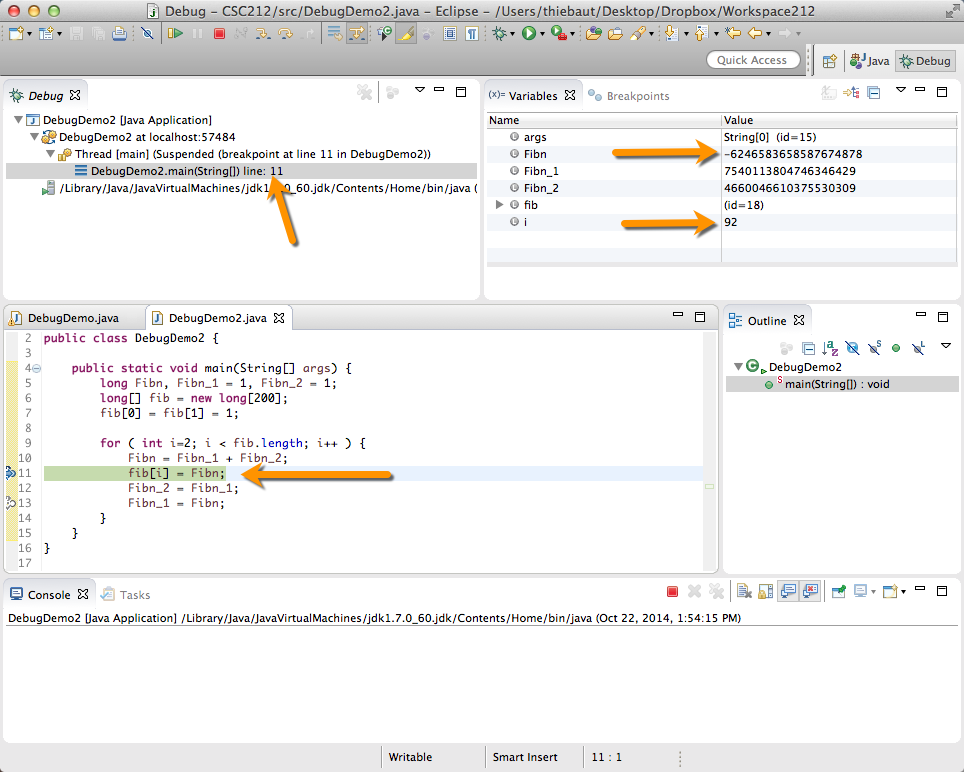
- Observe that the state of the program when the problem occurs is fully visible:
- Fibn is indeed negative (-6246583658587674878)
- i is 92, indicating that it occurs at Iteration 92 of the loop.
- we are indeed stopped on Line 11 of main(), in DebugDemo2.
- Click on the red square to kill the program.
Exercise
- Study the code below. Pay attention to the for-loop and what it computes.
import java.util.ArrayList;
import java.util.UUID;


class Triplet {
	public String s;
	int i, j;
	Triplet( String ss, int ii, int jj ) { s=ss; i=ii; j=jj; }
	public String toString() { return s+"("+i+ ", " + j + ")"; }
}

public class DebugDemo3 {
	static int seed = 1111;

	public static void main(String[] args) {
		ArrayList<Triplet> A = new ArrayList<Triplet>();
		int x, y;
		for ( int i=0; i<10000; i++ ) {
			String randomString = UUID.randomUUID().toString();
			x = randomInt();
			y = randomInt();
			A.add( new Triplet( randomString, x, y ) );
		}
	}

	private static int randomInt() {
		int x =  (11 + seed * 99563) % 104729;
		seed = (11 + x * 99563) % 104729;
		return seed & x;
	}
}
- Without printing anything on the screen, figure out at what index i, the loop above generates a new triplet that has 68616 for x, and -131030 for y.