Difference between revisions of "CSC212 Lab 13 2014"
(→Problem #5) |
(→Problem #3: GraphViz & Dot) |
||
| (15 intermediate revisions by the same user not shown) | |||
| Line 1: | Line 1: | ||
--[[User:Thiebaut|D. Thiebaut]] ([[User talk:Thiebaut|talk]]) 11:19, 17 November 2014 (EST) | --[[User:Thiebaut|D. Thiebaut]] ([[User talk:Thiebaut|talk]]) 11:19, 17 November 2014 (EST) | ||
---- | ---- | ||
| + | <br /> | ||
| + | <bluebox> | ||
| + | For Tuesday's lecture, do Problem #1 and Problem #2. | ||
| + | </bluebox> | ||
<br /> | <br /> | ||
=Problem #1: DFS= | =Problem #1: DFS= | ||
| Line 67: | Line 71: | ||
<br /> | <br /> | ||
| − | * You can test your dot definition at | + | * You can test your dot definition at these URLs: |
| + | ::* http://sandbox.kidstrythisathome.com/erdos/ | ||
| + | ::* http://stamm-wilbrandt.de/GraphvizFiddle/ | ||
<br /> | <br /> | ||
=Problem #4: 6 degrees of Separation= | =Problem #4: 6 degrees of Separation= | ||
[[Image:KevinBacon6Degrees.jpg|200px|right]] | [[Image:KevinBacon6Degrees.jpg|200px|right]] | ||
| − | * Have you ever heard of Kevin Bacon's degrees of separation? The idea is explained [http://en.wikipedia.org/wiki/Six_Degrees_of_Kevin_Bacon | + | * Have you ever heard of Kevin Bacon's degrees of separation? The idea is explained [http://en.wikipedia.org/wiki/Six_Degrees_of_Kevin_Bacon in this Wikipedia page]. |
| + | |||
| + | * Interesting tidbit found on the same [http://en.wikipedia.org/wiki/Six_Degrees_of_Kevin_Bacon Wikipedia page]: | ||
| + | <blockquote> | ||
| + | While at the University of Virginia, Brett Tjaden created the Oracle of Bacon, a computer program that uses information on some '''800,000''' people from the Internet Movie Database (IMDb). The algorithm calculates "how good a center" an individual IMDb personality is, i.e. a weighted average of the degree of separation of all the people that link to that particular person. | ||
| + | </blockquote> | ||
| + | :There is an interesting ''graph shortest-path'' algorithm that you can try on the ''Oracle of Bacon'' [http://oracleofbacon.org/ Web site]. | ||
<br /> | <br /> | ||
* Assume that we take 100 Hollywood stars and record the connections that they have had during the past year. This generates a graph shown below. Each number represents a Hollywood star. The list of stars and numbers is available [[100 Top Hollywood Stars| here]]. | * Assume that we take 100 Hollywood stars and record the connections that they have had during the past year. This generates a graph shown below. Each number represents a Hollywood star. The list of stars and numbers is available [[100 Top Hollywood Stars| here]]. | ||
| Line 88: | Line 100: | ||
<br /> | <br /> | ||
| − | =Problem #5= | + | |
| + | =Problem #5: Dijsktra & DFS= | ||
| + | <br /> | ||
| + | ==Part 1== | ||
| + | <br /> | ||
| + | * Create a new Java class called '''Graph2.java'''. Copy the code of this new implementation of a graph from this [[CSC212 Disjkstra's Shortest Path | page]]. | ||
| + | * Study the code carefully. See how the graph is now organized differently. We do not have an adjacency matrix, but objects that are vertices and edges. The edges contain two vertex objects. The vertices contain list of edges. It's an intricately linked data structure! | ||
| + | * Run the program and see how Dijkstra's shortest path is applied to the graph. You can change the graph by switching from ''generateSampleGraph2()'' to ''generateSampleGraph1()''. | ||
| + | <br /> | ||
| + | ;Question 1 | ||
| + | : Why does ''getShortestPathTo()'' call ''Collections.reverse(path)''? If you are not sure, comment out this line and see what the output looks like... | ||
| + | <br /> | ||
| + | ;Question 2 | ||
| + | <br /> | ||
| + | * Add a new method called ''dot()'' that will print out the DOT version of your graph. | ||
| + | * Below is the dot version generated by ''generateSampleGraph1()'' as a digraph (directed graph): | ||
| + | <br /> | ||
| + | {| width="100%"; | ||
| + | | | ||
| + | <source lang="dot"> | ||
| + | digraph G { | ||
| + | 0 -> 1 [label="5"]; | ||
| + | 0 -> 2 [label="10"]; | ||
| + | 0 -> 3 [label="8"]; | ||
| + | 1 -> 0 [label="5"]; | ||
| + | 1 -> 2 [label="3"]; | ||
| + | 1 -> 4 [label="7"]; | ||
| + | 2 -> 0 [label="10"]; | ||
| + | 2 -> 1 [label="3"]; | ||
| + | 3 -> 0 [label="8"]; | ||
| + | 3 -> 4 [label="2"]; | ||
| + | 4 -> 1 [label="7"]; | ||
| + | 4 -> 3 [label="2"]; | ||
| + | } | ||
| + | </source> | ||
| + | | | ||
| + | | ||
| + | | ||
| + | | ||
| + | | ||
| + | | ||
| + | | ||
| + | | ||
| + | | ||
| + | | ||
| + | | ||
| + | | ||
| + | | ||
| + | | ||
| + | | ||
| + | | ||
| + | | ||
| + | | ||
| + | | ||
| + | | ||
| + | | ||
| + | | ||
| + | | ||
| + | |||
| + | | | ||
| + | [[Image:SampleGraph1.png|300px]] | ||
| + | |} | ||
| + | |||
| + | <br /> | ||
| + | * Side note (You do not have to implement any code for this): If all edges are bi-directional (graph1 verifies this property, but not graph2), you can generate a different dot version of the graph, where the header this time is '''strict graph G''', and edges are represented by '''--'''. | ||
| + | |||
| + | <br /> | ||
| + | {| width="100%"; | ||
| + | | | ||
| + | <source lang="dot"> | ||
| + | strict graph G { | ||
| + | 0 -- 1 [label="5"]; | ||
| + | 0 -- 2 [label="10"]; | ||
| + | 0 -- 3 [label="8"]; | ||
| + | 1 -- 0 [label="5"]; | ||
| + | 1 -- 2 [label="3"]; | ||
| + | 1 -- 4 [label="7"]; | ||
| + | 2 -- 0 [label="10"]; | ||
| + | 2 -- 1 [label="3"]; | ||
| + | 3 -- 0 [label="8"]; | ||
| + | 3 -- 4 [label="2"]; | ||
| + | 4 -- 1 [label="7"]; | ||
| + | 4 -- 3 [label="2"]; | ||
| + | } | ||
| + | </source> | ||
| + | | | ||
| + | | ||
| + | | ||
| + | | ||
| + | | ||
| + | | ||
| + | | ||
| + | | ||
| + | | ||
| + | | ||
| + | | ||
| + | | ||
| + | | ||
| + | | ||
| + | | ||
| + | | ||
| + | | ||
| + | | ||
| + | | ||
| + | | ||
| + | | ||
| + | | ||
| + | | ||
| + | |||
| + | | | ||
| + | [[Image:StrictSampleGraph1.png|250px]] | ||
| + | |} | ||
| + | |||
| + | <br /> | ||
| + | *For reference, this is the dot version generated for ''generateSampleGraph2()''. | ||
<br /> | <br /> | ||
| − | + | {| width="100%"; | |
| + | | | ||
| + | <source lang="dot"> | ||
| + | digraph G { | ||
| + | 0 -> 3 [label="1"]; | ||
| + | 0 -> 6 [label="1"]; | ||
| + | 1 -> 5 [label="5"]; | ||
| + | 1 -> 2 [label="1"]; | ||
| + | 1 -> 4 [label="3"]; | ||
| + | 2 -> 1 [label="1"]; | ||
| + | 2 -> 4 [label="2"]; | ||
| + | 2 -> 6 [label="5"]; | ||
| + | 3 -> 0 [label="1"]; | ||
| + | 3 -> 4 [label="9"]; | ||
| + | 4 -> 1 [label="3"]; | ||
| + | 4 -> 2 [label="2"]; | ||
| + | 4 -> 6 [label="2"]; | ||
| + | 2 -> 3 [label="9"]; | ||
| + | 5 -> 1 [label="5"]; | ||
| + | 6 -> 2 [label="5"]; | ||
| + | 6 -> 4 [label="2"]; | ||
| + | 6 -> 0 [label="1"]; | ||
| + | } | ||
| + | </source> | ||
| + | | | ||
| + | | ||
| + | | ||
| + | | ||
| + | | ||
| + | | ||
| + | | ||
| + | | ||
| + | | ||
| + | | ||
| + | | ||
| + | | ||
| + | | ||
| + | | ||
| + | | ||
| + | | ||
| + | | ||
| + | | ||
| + | | ||
| + | | ||
| + | | ||
| + | | ||
| + | | ||
| + | |||
| + | | | ||
| + | [[Image:SampleGraph2.png|300px]] | ||
| + | |} | ||
| + | |||
| + | ==Part 2== | ||
<br /> | <br /> | ||
| + | * Add DFS() to Graph2 and '''test it'''. You will need to take the DFS code from Graph1.java (2 methods), and modify this code to make it work with Vertex and Edge objects. It's tricky! I recommend adding a few useful methods: | ||
| + | ::* a method in Graph2 that will return the number of vertices in the graph. | ||
| + | ::* a method in Vertex that will return the adjacency list of the vertex. | ||
| + | * Here's what the new main() should look like, and its output: | ||
<br /> | <br /> | ||
| + | ::<source lang="java"> | ||
| + | public static void main(String[] args) { | ||
| + | Graph2 G = new Graph3(); | ||
| + | G.vertices = generateSampleGraph2(); | ||
| + | //G.displayShortestPaths( G.vertices[5] ); | ||
| + | G.DFS( G.vertices[0] ); | ||
| + | } | ||
| + | </source> | ||
<br /> | <br /> | ||
| + | :Output | ||
<br /> | <br /> | ||
| + | :::<source lang="text"> | ||
| + | DFS Starting on Vertex 0: | ||
| + | visiting Edge (0)---(3) | ||
| + | visiting Edge (3)---(4) | ||
| + | visiting Edge (4)---(1) | ||
| + | visiting Edge (1)---(5) | ||
| + | visiting Edge (1)---(2) | ||
| + | visiting Edge (2)---(6) | ||
| + | |||
| + | </source> | ||
| + | |||
| + | |||
<br /> | <br /> | ||
<br /> | <br /> | ||
Latest revision as of 09:30, 21 November 2014
--D. Thiebaut (talk) 11:19, 17 November 2014 (EST)
For Tuesday's lecture, do Problem #1 and Problem #2.
Contents
Problem #1: DFS
- Create a new program called Graph1.java and copy the code from this page.
- Implement the DFS function, with the main DFS function calling a recursive helper DFSRecurse function.
- Question 1
- Make your new DFS start with a vertex of your choice, and display all the vertices it visits. Below is an example of the output for G.DFS( 0 ).
DFS starting on 0: 0, 1, 2, 4, 3, 7, 8, 5, 6,
- Question 2
- Same question, but this time make DFS print the edges of the graph it visits. Below is an example of the output for G.DFS(0).
DFS starting on 0:
visiting Edge (0)---(1)
visiting Edge (1)---(2)
visiting Edge (1)---(4)
visiting Edge (4)---(3)
visiting Edge (3)---(7)
visiting Edge (7)---(8)
visiting Edge (1)---(5)
visiting Edge (5)---(6)
Problem #2: Connected Components
- A graph is connected if there is a path from any vertex to any other vertex in the graph.
- Create a new method called isConnected( ) that is based on DFS, and that returns true if the graph is connected, and false otherwise.
- The graph created by the init1() method is connected. You will need to add a new method called, say, init2() that initializes the graph with several disconnected components. (Hints: You can probably remove some edges from the graph generated by init1() to get a graph with several components!)
Problem #3: GraphViz & Dot
- Add a method to your graph that will print the graph in dot language, as we did with trees a while back.
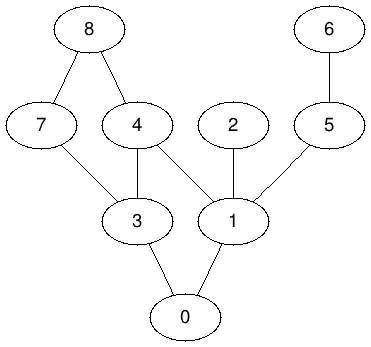
- Here's the dot version of the graph generated by init1():
|
- You can test your dot definition at these URLs:
Problem #4: 6 degrees of Separation
- Have you ever heard of Kevin Bacon's degrees of separation? The idea is explained in this Wikipedia page.
- Interesting tidbit found on the same Wikipedia page:
While at the University of Virginia, Brett Tjaden created the Oracle of Bacon, a computer program that uses information on some 800,000 people from the Internet Movie Database (IMDb). The algorithm calculates "how good a center" an individual IMDb personality is, i.e. a weighted average of the degree of separation of all the people that link to that particular person.
- There is an interesting graph shortest-path algorithm that you can try on the Oracle of Bacon Web site.
- Assume that we take 100 Hollywood stars and record the connections that they have had during the past year. This generates a graph shown below. Each number represents a Hollywood star. The list of stars and numbers is available here.
- Question 1
- Figure out a way to have your program output the Id of all the stars who are 1 degree away from Kevin Bacon.
- Question 2
- Make your program output the Ids of all the stars who are at most 4 degrees away from Kevin Bacon.
- Question 3
- Output all the Ids of the stars who are at an ∞ degree from Kevin Bacon.
Problem #5: Dijsktra & DFS
Part 1
- Create a new Java class called Graph2.java. Copy the code of this new implementation of a graph from this page.
- Study the code carefully. See how the graph is now organized differently. We do not have an adjacency matrix, but objects that are vertices and edges. The edges contain two vertex objects. The vertices contain list of edges. It's an intricately linked data structure!
- Run the program and see how Dijkstra's shortest path is applied to the graph. You can change the graph by switching from generateSampleGraph2() to generateSampleGraph1().
- Question 1
- Why does getShortestPathTo() call Collections.reverse(path)? If you are not sure, comment out this line and see what the output looks like...
- Question 2
- Add a new method called dot() that will print out the DOT version of your graph.
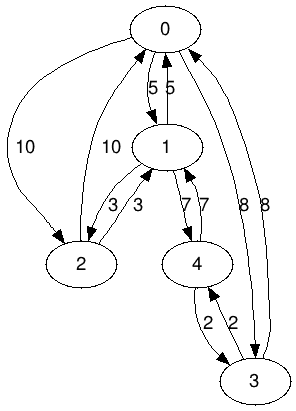
- Below is the dot version generated by generateSampleGraph1() as a digraph (directed graph):
digraph G {
0 -> 1 [label="5"];
0 -> 2 [label="10"];
0 -> 3 [label="8"];
1 -> 0 [label="5"];
1 -> 2 [label="3"];
1 -> 4 [label="7"];
2 -> 0 [label="10"];
2 -> 1 [label="3"];
3 -> 0 [label="8"];
3 -> 4 [label="2"];
4 -> 1 [label="7"];
4 -> 3 [label="2"];
} |
|
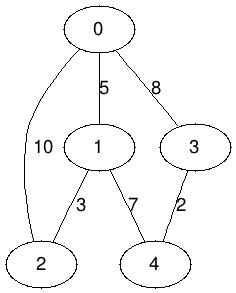
- Side note (You do not have to implement any code for this): If all edges are bi-directional (graph1 verifies this property, but not graph2), you can generate a different dot version of the graph, where the header this time is strict graph G, and edges are represented by --.
strict graph G {
0 -- 1 [label="5"];
0 -- 2 [label="10"];
0 -- 3 [label="8"];
1 -- 0 [label="5"];
1 -- 2 [label="3"];
1 -- 4 [label="7"];
2 -- 0 [label="10"];
2 -- 1 [label="3"];
3 -- 0 [label="8"];
3 -- 4 [label="2"];
4 -- 1 [label="7"];
4 -- 3 [label="2"];
} |
|
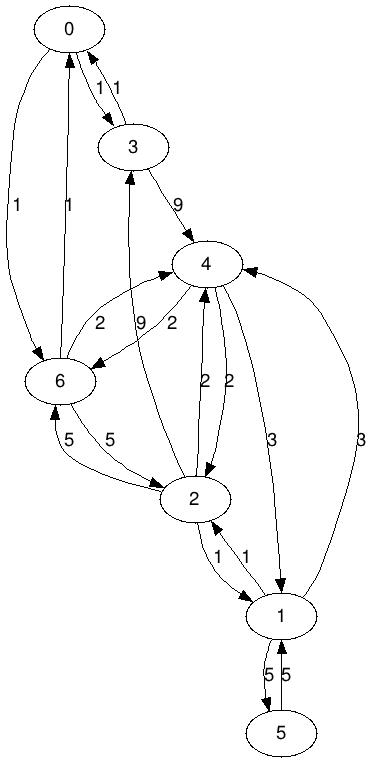
- For reference, this is the dot version generated for generateSampleGraph2().
digraph G {
0 -> 3 [label="1"];
0 -> 6 [label="1"];
1 -> 5 [label="5"];
1 -> 2 [label="1"];
1 -> 4 [label="3"];
2 -> 1 [label="1"];
2 -> 4 [label="2"];
2 -> 6 [label="5"];
3 -> 0 [label="1"];
3 -> 4 [label="9"];
4 -> 1 [label="3"];
4 -> 2 [label="2"];
4 -> 6 [label="2"];
2 -> 3 [label="9"];
5 -> 1 [label="5"];
6 -> 2 [label="5"];
6 -> 4 [label="2"];
6 -> 0 [label="1"];
} |
|
Part 2
- Add DFS() to Graph2 and test it. You will need to take the DFS code from Graph1.java (2 methods), and modify this code to make it work with Vertex and Edge objects. It's tricky! I recommend adding a few useful methods:
- a method in Graph2 that will return the number of vertices in the graph.
- a method in Vertex that will return the adjacency list of the vertex.
- Here's what the new main() should look like, and its output:
        public static void main(String[] args) {
		Graph2 G = new Graph3();
		G.vertices = generateSampleGraph2();
		//G.displayShortestPaths( G.vertices[5] );
		G.DFS( G.vertices[0] );
	}
- Output
DFS Starting on Vertex 0:
visiting Edge (0)---(3)
visiting Edge (3)---(4)
visiting Edge (4)---(1)
visiting Edge (1)---(5)
visiting Edge (1)---(2)
visiting Edge (2)---(6)


