Difference between revisions of "MatPlotLib Tutorial 1"
(→Setup) |
(→Testing) |
||
| Line 45: | Line 45: | ||
</center> | </center> | ||
<br /> | <br /> | ||
| + | |||
| + | =Scatter Plot of (X, Y) points= | ||
| + | |||
| + | * | ||
Revision as of 10:21, 25 April 2011
--D. Thiebaut 10:27, 25 April 2011 (EDT)
|
|
Setup
We use the Eclipse IDE and PyDev to develop Python packages. If you want to setup your environment to match the one used here you will need to install:
- Eclipse: http://www.eclipse.org/downloads/
- Python: http://www.python.org/download/
- PyDev: http://pydev.org/download.html
- EDP from Enthought: https://www.enthought.com/products/. It contains all you need to run MatPlotLib.
Default Python
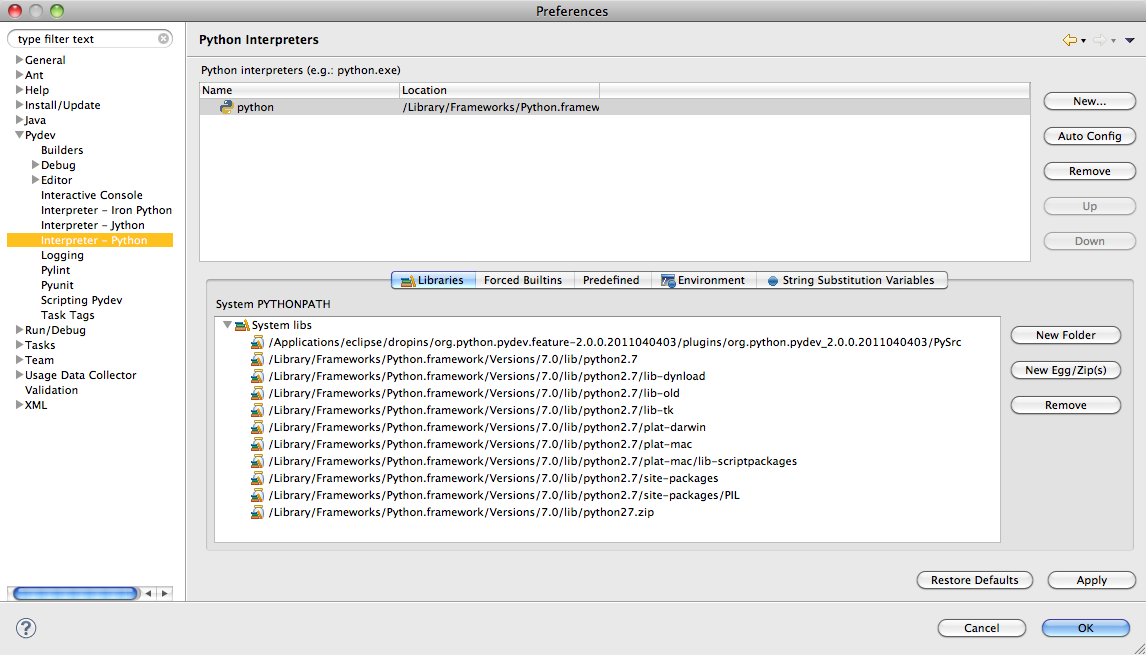
- You should make the Python version installed by EDP as the default Python interpreter for Eclipse/PyDev.
- First open a Terminal window and type:
 which python
 /Library/Frameworks/Python.framework/Versions/Current/bin/python
- Record the answer to the command and enter it in Eclipse's Preference window for PyDev:

Testing
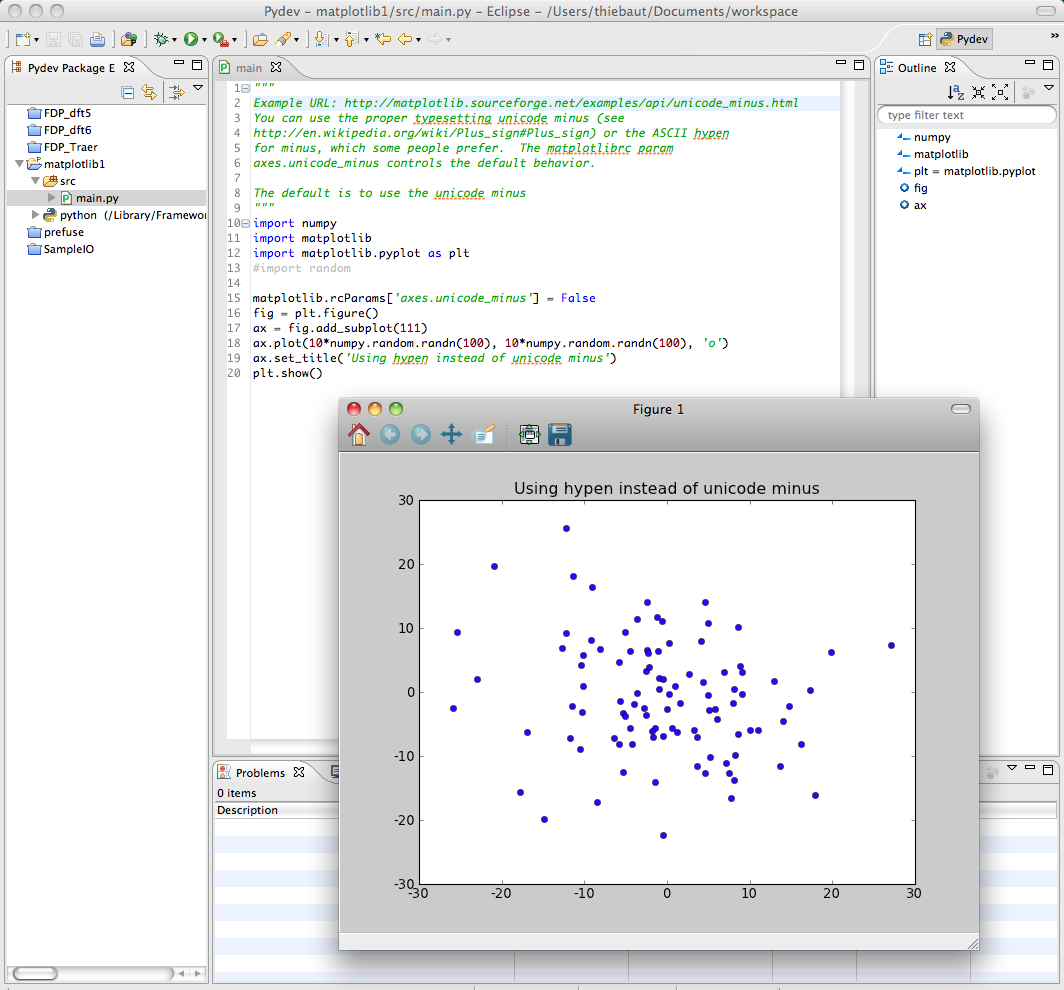
- To test that your installation is ready to go, load up the code from this URL http://matplotlib.sourceforge.net/examples/api/unicode_minus.html and run it. You should get a plot, as shown below:

