Difference between revisions of "CSC111 Lab 5 2011"
(→Directions for Mac laptops) |
(→Challenge 4) |
||
| Line 137: | Line 137: | ||
[[Image:QuestionMark5.jpg|right|120px]] | [[Image:QuestionMark5.jpg|right|120px]] | ||
| − | * Insert this statement inside the loop that displays the circle, at the beginning of the loop: | + | * Insert this statement inside the loop that displays the circle, at the beginning of the loop, right under the '''for ...''' statement: |
win.getMouse() | win.getMouse() | ||
Revision as of 11:03, 6 October 2011
Contents
Setup your 111a-xx account for Graphics
This section deals with setting up your environment to run graphics python-programs.
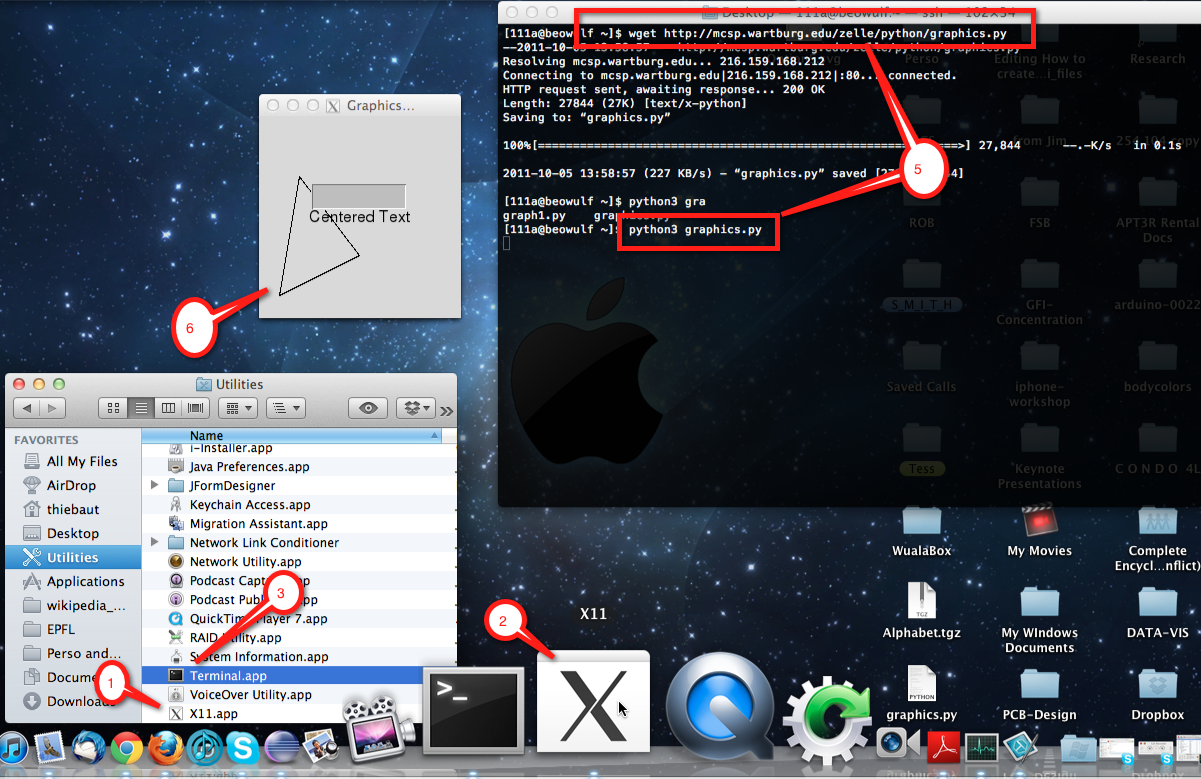
The whole process is illustrated by the image below
First, Login to the Mac with your 111a-xx account, and then follow the steps below, referring to the image above
- Open the Finder window, then the Utilities folder, then click on X11
- Depending on which version of Mac OS you are using, this may open a white XTerm window in the top left of the screen, or not. If it appears, simply iconize this xterm (or "X11") window to clean up your desktop. We don't use it directly, but it needs to be running for us to use it.
- Use the same steps (Finder --> Utilities) and open a Terminal window.
- A new black window opens up.
- In it, login to beowulf as usual:
ssh -Y 111a-xx@beowulf.csc.smith.edu
wget http://mcsp.wartburg.edu/zelle/python/graphics.py
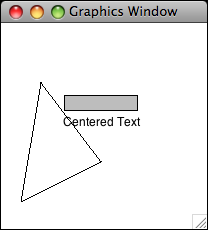
python3 graphics.py - If everything goes well, you should see the small gray window with a triangle and a rectangle, with the words Centered Text.
- Click on this graphics window a few times to interact with the graphics. At some point the window will close. This is a simple test function that is part of the graphics library that runs only when you use the library as a program (not as a module).
Play
- Open Python in interactive mode, and try the various graphics functions (taken from Zelle's textbook):
  >>> from graphics import *
  >>> win = GraphWin( "Lab 5 Demo" )
  >>> center = Point( 100, 100 )
  >>> circ = Circle( center, 30 )
  >>> circ.setFill( 'red' )
  >>> circ.draw( win )
  >>> label = Text( center, "red circle" )
  >>> label.draw( win )
  >>> rect = Rectangle( Point( 30, 30 ), Point( 70, 70 ) )
  >>> rect.draw( win )
  >>> win.close()
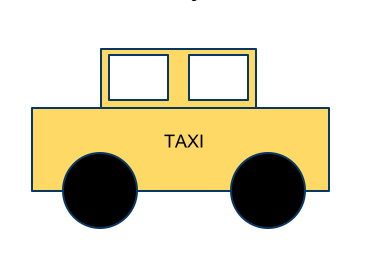
- Using this first bit of knowledge, draw a car on a piece of graph paper (if you can't find one in class, print one using this utility: http://incompetech.com/graphpaper/plain/), and once you have the coordinates of all the points, see if you can generate the car.
Repeated Shapes
- Create a new program with the code shown below:
from graphics import *

def main():
    win = GraphWin( "lab 5", 800, 600 )

    c = Circle( Point( 50, 60 ), 20 )
    c.draw( win )
    c = Circle( Point( 50+100, 60 ), 20 )
    c.draw( win )
    c = Circle( Point( 50+200, 60 ), 20 )
    c.draw( win )

    win.getMouse()
    win.close()


main()
- Run it! See the 3 circles?
Challenge 1 |
- Modify your code that it displays the exact same circles, at the same locations, but using a loop that will go 3 times around, and every time will display a new circle.
- ( Hints: Can you write a loop that prints 1 number per loop, that goes 3 times and that prints the following three numbers: 50, 150, 250?)
Challenge 2 |
- Modify your loop so that it displays 8 equally spaced circles:

Challenge 3 |
- Make your program put the circles on a diagonal, going from top left to bottom right.
Challenge 4 |
- Insert this statement inside the loop that displays the circle, at the beginning of the loop, right under the for ... statement:
win.getMouse()
- Can you guess what the behavior of your program is going to be?
- Check whether you have guessed right...
Challenge 5 (harder) |
- Create a new program with the code below and run it. Make sure you understand why the output looks the way it does. Feel free to modify the two range functions in the code to see how they control the output.
def main():
    print( "Begin" )
    for i in range( 5 ):
        for j in range( 8 ):
             print( "[", i, j, "]", end='' )
        print()
    print( "Done!" )

main()
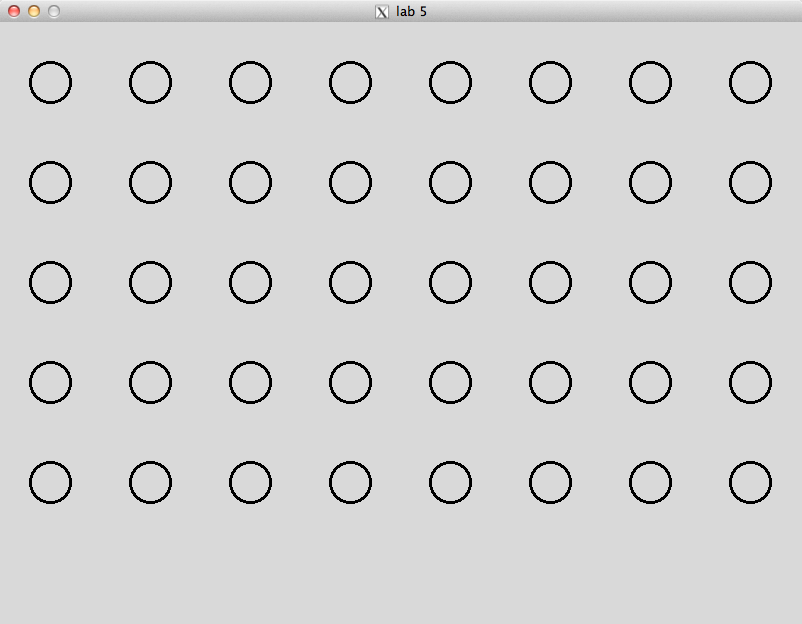
- Use the double loop and incorporate it in your circle drawing program so that displays 5 lines of 8 circles...
Stop and Go operation
- For this part, use the new program below or pick one of your circle drawing versions
from graphics import *

def main():
    win = GraphWin( "lab 5", 800, 600 )

    for i in range( 0, 800, 100 ):
        # insert win.getMouse() here!
        c = Circle( Point( 50+i, 60 ), 20 )
        c.draw( win )

    win.getMouse()
    win.close()

main()
- Insert a win.getMouse() statement inside the loop, right at the beginning:
- Predict how the program will behave when you run it.
- You can use this technique to debug your graphics programs and make them progress one step at a time...
Lines
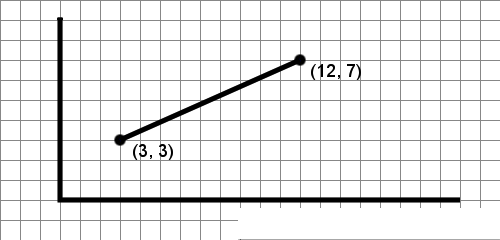
- Drawing a line requires defining two points and having the Graphics system draw a line between them:
- Try these different examples, one at a time:
     # first example
     line = Line( Point( 10, 10 ), Point( 100, 10 ) )
     line.draw( win )
     # Example 2
     for y in range( 10, 100, 10 ):
         line = Line( Point( 10, y ), Point( 100, y ) )
         line.draw( win )
     # Example 3
     for x in range( 10, 100, 10 ):
         line = Line( Point( x, 10 ), Point( x, 100 ) )
         line.draw( win )
     # Example 4
     for x in range( 10, 100, 10 ):
         line = Line( Point( 10, 10 ), Point( x, 100 ) )
         line.draw( win )
Challenge 6 |
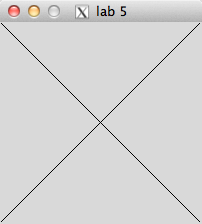
- Make your program display two diagonals:
Challenge 7 |
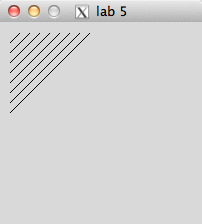
- Make your program display this set of several 45-degree lines:
You are now ready for Homework 4!
Installing the Graphics Package on your laptop (Optional)
Use these directions if you would like to have python and the graphics library installed on your own computer.
Directions for Windows laptops
(These directions were inspired by directions posted at the Rose-Hulman Institute of Technology)
Python
These directions assume that you are starting from scratch and that Python is not installed on your Windows machine.
- First, Install Python 3 on your machine, if you haven't already done so.
- Logon as an adminstrator if you have a regular user account and an administrator account for your laptop (most people use the same for both).
- Download Python (it's free!). Visit http://www.python.org/download/ and select the Python 3.x x86 Windows installer.
- Run the installer, installing it in C:\Program Files\Python3.x\. The other defaults are fine to use.
- Change the directory that the Python development environment, IDLE, starts in when loading and saving files. (By default it looks for and saves files in the program directory.)
- Log into your regular user account if it is different from your administrator account.
- Click on Start → All Programs → Python 3.x
- Right-click on IDLE (Python GUI) and choose Properties
- Change the Start in: field to point to the place where you want to keep Python program files. A good choice might be C:\Documents and Settings\yourname\My Documents\PythonFiles. (An easy way to get that path name: Open My Documents and browse to the folder. Select the pathname in the Address bar; Copy. Go back to the Idle Properties Window, and Paste into the Start In field.) Whatever folder you decide to use, you will need to use Windows Explorer to create it if it does not exist.
- Then load the Zelle Graphics library
- Download this file graphics.py.
- Save the file graphics.py in the directory C:\Program Files\Python3.x\Lib\site-packages
- Potential “gotchas”: (1) That is Lib, not libs, in the path. (2) if you installed Python in a different location than C:\Program Files\Python3.x, you’ll need to find your Python3.x\Lib\site-packages folder.
- To verify your installation
- Launch IDLE by clicking Start → All Programs → Python 3.x→ IDLE (Python GUI)
- At the prompt type:
from graphics import *
- if you do not get an error message, then the installation was successful.
Directions for Mac laptops
- Use Finder to create a new folder in your favorite spot. For example you can create a folder called CSC111 on your Desktop.
- Download this file graphics.py. Put it in the directory (folder) you created above.
- Open a terminal window, and type the following commands:
 cd
 cd Desktop
 cd CSC111            (or whatever directory you decided to create)
 idle3.x testgraphics.py
- create the following python program and call it testgraphics.py:
 from graphics import *
 def main():
     test()

 main()
- Run it!
python3 testgraphics.py
- (this assumes that you have python 3 installed on your Mac. The command may also be python3.x, where x is some number...
- You should get this new window on your screen:
