Difference between revisions of "CSC103 Plotting with R"
(Created page with "--~~~~ ---- =Generating Plots with R= [http://www.r-project.org/ R] is a free statistical package that can be used to quickly generate simple but nice looking graphs. The gr...") |
(→Source) |
||
| Line 22: | Line 22: | ||
plot(x,y, main="Exponential Growth", xlab="Square", ylab="Number of Grains", pch=15 ) | plot(x,y, main="Exponential Growth", xlab="Square", ylab="Number of Grains", pch=15 ) | ||
dev.off() | dev.off() | ||
| + | plot(x,y, main="Exponential Growth", xlab="Square", ylab="Number of Grains", pch=15 ) | ||
<br /> | <br /> | ||
Latest revision as of 16:14, 29 September 2013
--D. Thiebaut (talk) 16:13, 29 September 2013 (EDT)
Generating Plots with R
R is a free statistical package that can be used to quickly generate simple but nice looking graphs.
The graphs below were generated for the class notes in CSC103. The code is included.
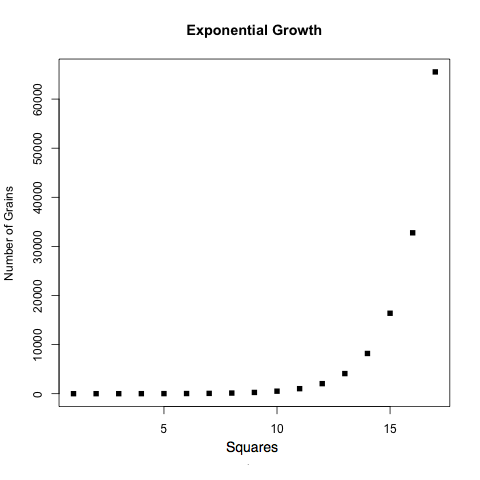
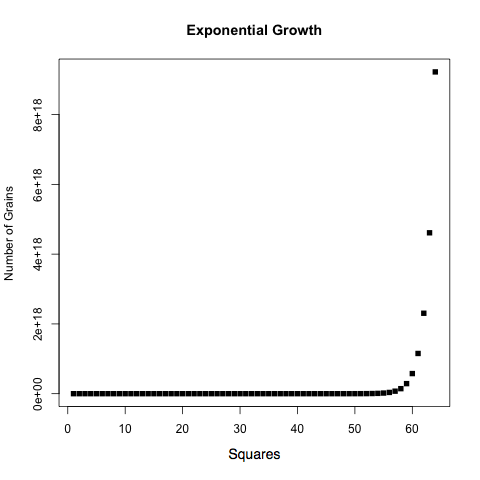
Plots of Exponential Growth
Source
png(filename="/Users/thiebaut/Desktop/expGrowth4.png" )
x=1:64
y=2^(x-1)
plot(x,y, main="Exponential Growth", xlab="Square", ylab="Number of Grains", pch=15 )
dev.off()
plot(x,y, main="Exponential Growth", xlab="Square", ylab="Number of Grains", pch=15 )

