Difference between revisions of "Debugging with Eclipse: A Quick Introduction"
(→Debugging DebugDemo) |
(→Set A Breakpoint) |
||
| Line 87: | Line 87: | ||
<center>[[Image:EclipseDebugger4.png|500px]]</center> | <center>[[Image:EclipseDebugger4.png|500px]]</center> | ||
<br /> | <br /> | ||
| + | ==Run the Program== | ||
| + | * Now that you have a breakpoint, you can run the program; it will automatically go through the initialization, and will stop on the breakpoint. It will not execute line 17, though. It will simply '''break''' on it. | ||
| + | * Click on the '''bug''', next to the green circle with white arrow to start debugging the program. | ||
| + | <br /> | ||
| + | <br /> | ||
| + | <center>[[Image:EclipseDebugger5.png|700px]]</center> | ||
| + | <br /> | ||
| + | * Note several new pieces of information that have appeared | ||
| + | :* The top-right tab called '''Variables''' shows you the local variables of the block you are in | ||
| + | :* The top menu has 2 new active buttons, one for '''stepping into lines of code''', one for '''stepping over lines of code'''. The difference is that '''Step into''' will take you '''inside''' functions that appear in the line of code you're debugging. '''Step Over''' will run the functions appearing in the current code line full speed. Most of the time, we want to use '''Step Over'''. | ||
Revision as of 10:12, 22 October 2014
--D. Thiebaut (talk) 10:44, 22 October 2014 (EDT)
Contents
This is a short tutorial on how to get started with the Eclipse Debugger. Mastering the debugger takes time. The purpose of this lab/tutorial is just to show you how to get started.
Getting Started
- Open Eclipse
- Create a New Java Class. Call it DebugDemo.
- Enter this code in it:
// DebugDemo.java
// D. Thiebaut
// CSC212
import java.util.ArrayList;
import java.util.Iterator;

class Pair {
	public String name;
	public int age;
	Pair( String f, int s ) { name=f; age=s; }
	public String toString() { return name+"("+age+") "; }
}

public class DebugDemo {


	public static void main(String[] args) {
                ArrayList<Pair> A = new ArrayList<Pair>();
		int increment = 3;

		A.add( new Pair( "Alice", 10 ) );
		A.add( new Pair( "Bob", 7 ) );

		Iterator<Pair> it = A.iterator();
		while ( it.hasNext() ) {
			Pair p = it.next();
			p.age += increment;
		}

		for ( int i=0; i<3; i++ ) {
			Pair p = A.get(  i );
			System.out.println( A.get( i ) );
		}
	}

}
- Run it.
- Observe what the program does. It simply creates an array of 2 pairs, containing Alice(10) and Bob(7), and modify the age of both by an increment of 3.
Go into Debugging Mode
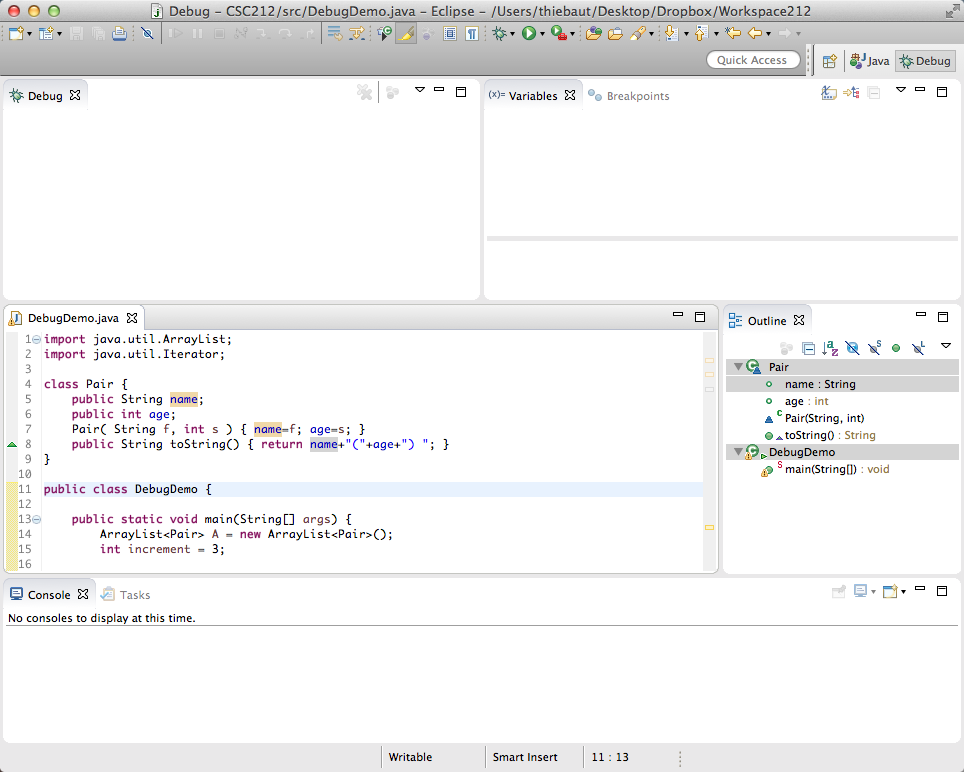
- In the Package Explorer tab (left tab), right/control click on DebugDemo and select Debug As and Java Application.
- The windows will reorganize themselves (if not, see below):

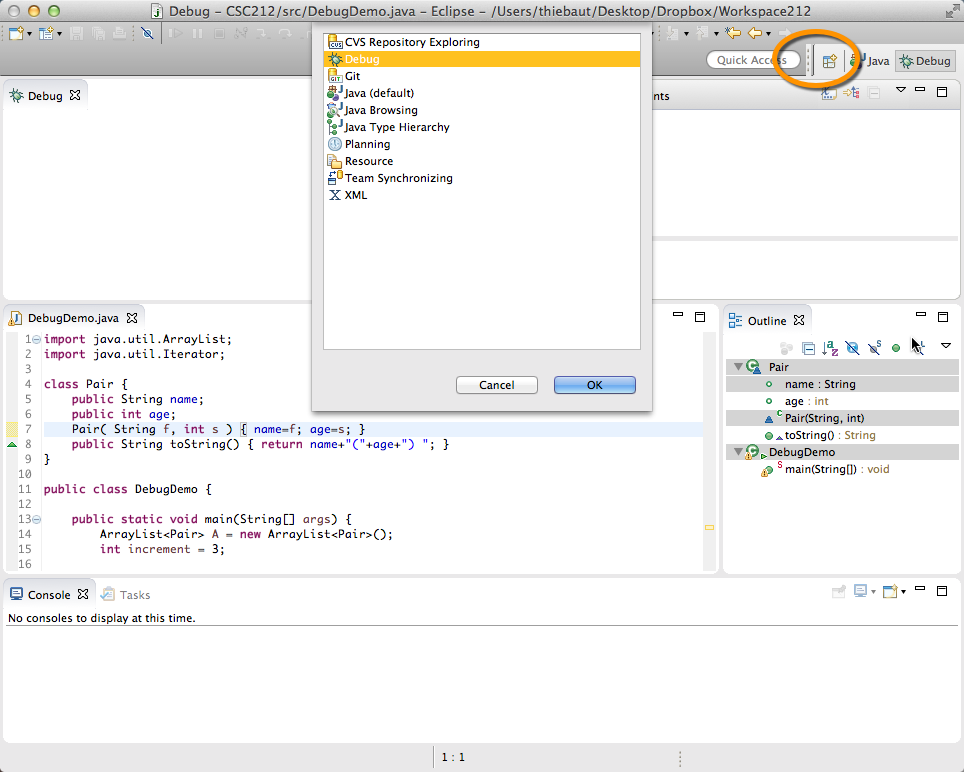
- If you do not get the window shown above, click on the little "table and plus symbol" in the top right of the window, and pick Debug in the new pop-up window :

- You can switch back and forth between Java coding and debugging using the Java and Debug buttons in the top right of the Eclipse window.
Getting Ready to Debug
- One of the best method to start when debugging is to follow this 3-step approach:
- Set a breakpoint on a line of code where you want to start observing what your program is doing.
- Run your program full speed. As soon as the computer reaches the breakpoint, it will stop (but not exit), and wait for your instructions.
- Single-step your program, observing how the different variables and data structures evolve.
Set A Breakpoint
- We will want to start watching our program from the beginning of main, when the program puts the first pair in the array.
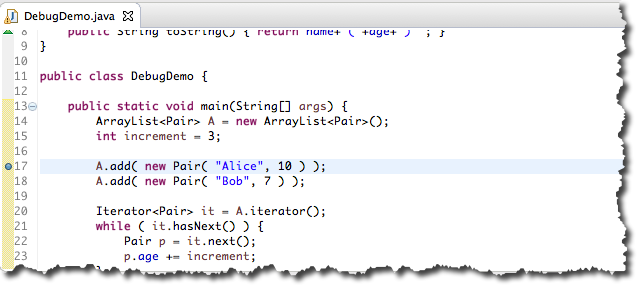
- Put your cursor in the 17 in the left margin of A.add( new Pair( "Alice", 10 ) );
- Right/Control click on 17.
- Select Toggle Breakpoint. A blue dot should appear left of 17.

Run the Program
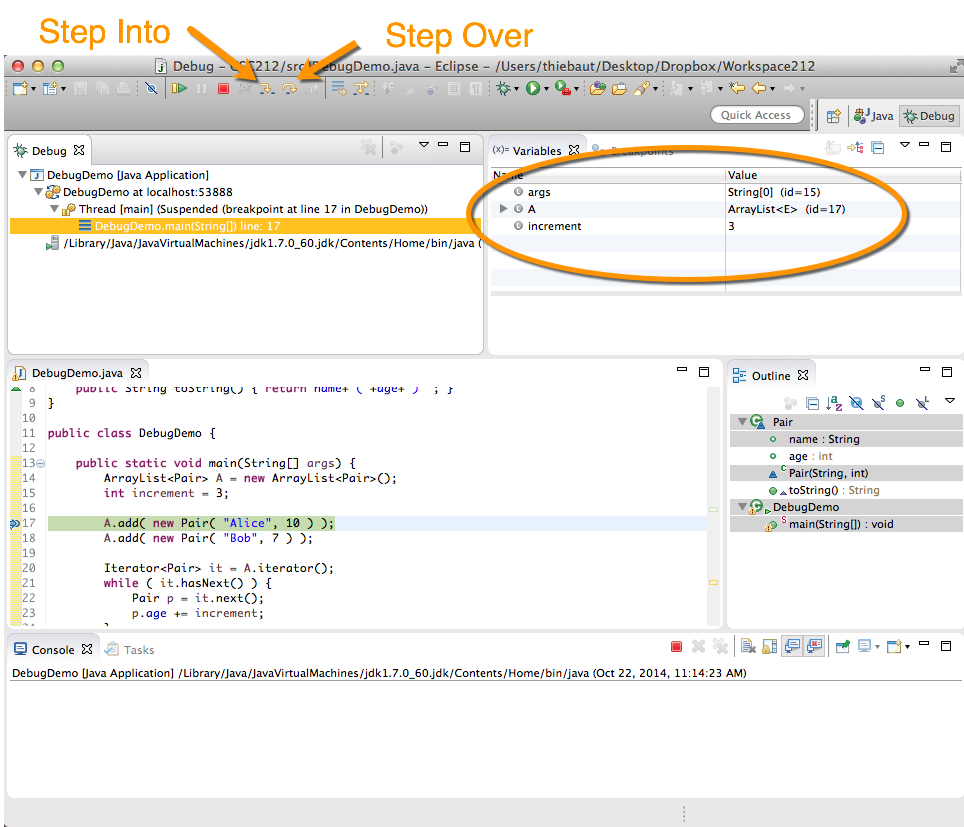
- Now that you have a breakpoint, you can run the program; it will automatically go through the initialization, and will stop on the breakpoint. It will not execute line 17, though. It will simply break on it.
- Click on the bug, next to the green circle with white arrow to start debugging the program.

- Note several new pieces of information that have appeared
- The top-right tab called Variables shows you the local variables of the block you are in
- The top menu has 2 new active buttons, one for stepping into lines of code, one for stepping over lines of code. The difference is that Step into will take you inside functions that appear in the line of code you're debugging. Step Over will run the functions appearing in the current code line full speed. Most of the time, we want to use Step Over.