Difference between revisions of "CSC212 Lab 15 2014"
(→The Model) |
(→The Model) |
||
| Line 32: | Line 32: | ||
::* get the adjacency list of a vertex | ::* get the adjacency list of a vertex | ||
* Change the '''probability100''' variable; it controls the probability of creating an edge between a vertex and its neighbors. Its value should range between 0 and 100. The lower the value, the less connected the graph is. The closest to 100, the more fully interconnected the vertices get. Run the applet again to see how connected or disconnected your grid becomes. | * Change the '''probability100''' variable; it controls the probability of creating an edge between a vertex and its neighbors. Its value should range between 0 and 100. The lower the value, the less connected the graph is. The closest to 100, the more fully interconnected the vertices get. Run the applet again to see how connected or disconnected your grid becomes. | ||
| + | * Change the '''maxNoVerticesRows''' and '''maxNoVerticesCols''' which define the number of rows and columns of the grid to something different. Say 40, 60. Or 60, 100. Notice that the visualization will match the new geometry. | ||
<br /> | <br /> | ||
Revision as of 11:54, 27 November 2014
--D. Thiebaut (talk) 09:43, 27 November 2014 (EST)
This lab introduces the Model-View-Controller (MVC) system for implementing Graphical User Interfaces (GUI). Please review the slides from the MVC lecture notes if necessary.
Contents
First Contact
- Create a new project, or add new files to an existing project. You will need to import core.jar from the Processing 2 app into your project, and then add it to the build path.
- You need to create 3 different classes, one for the controller, one for the viewer, and one for the model.
- MVC1_controller.java
- MVC1_viewer.java
- MVC1_model.java
- This tutorial contains the code for all three classes. Copy/paste the code into your three classes.
Run the Applet
- The starting class is the viewer. It's the applet class.
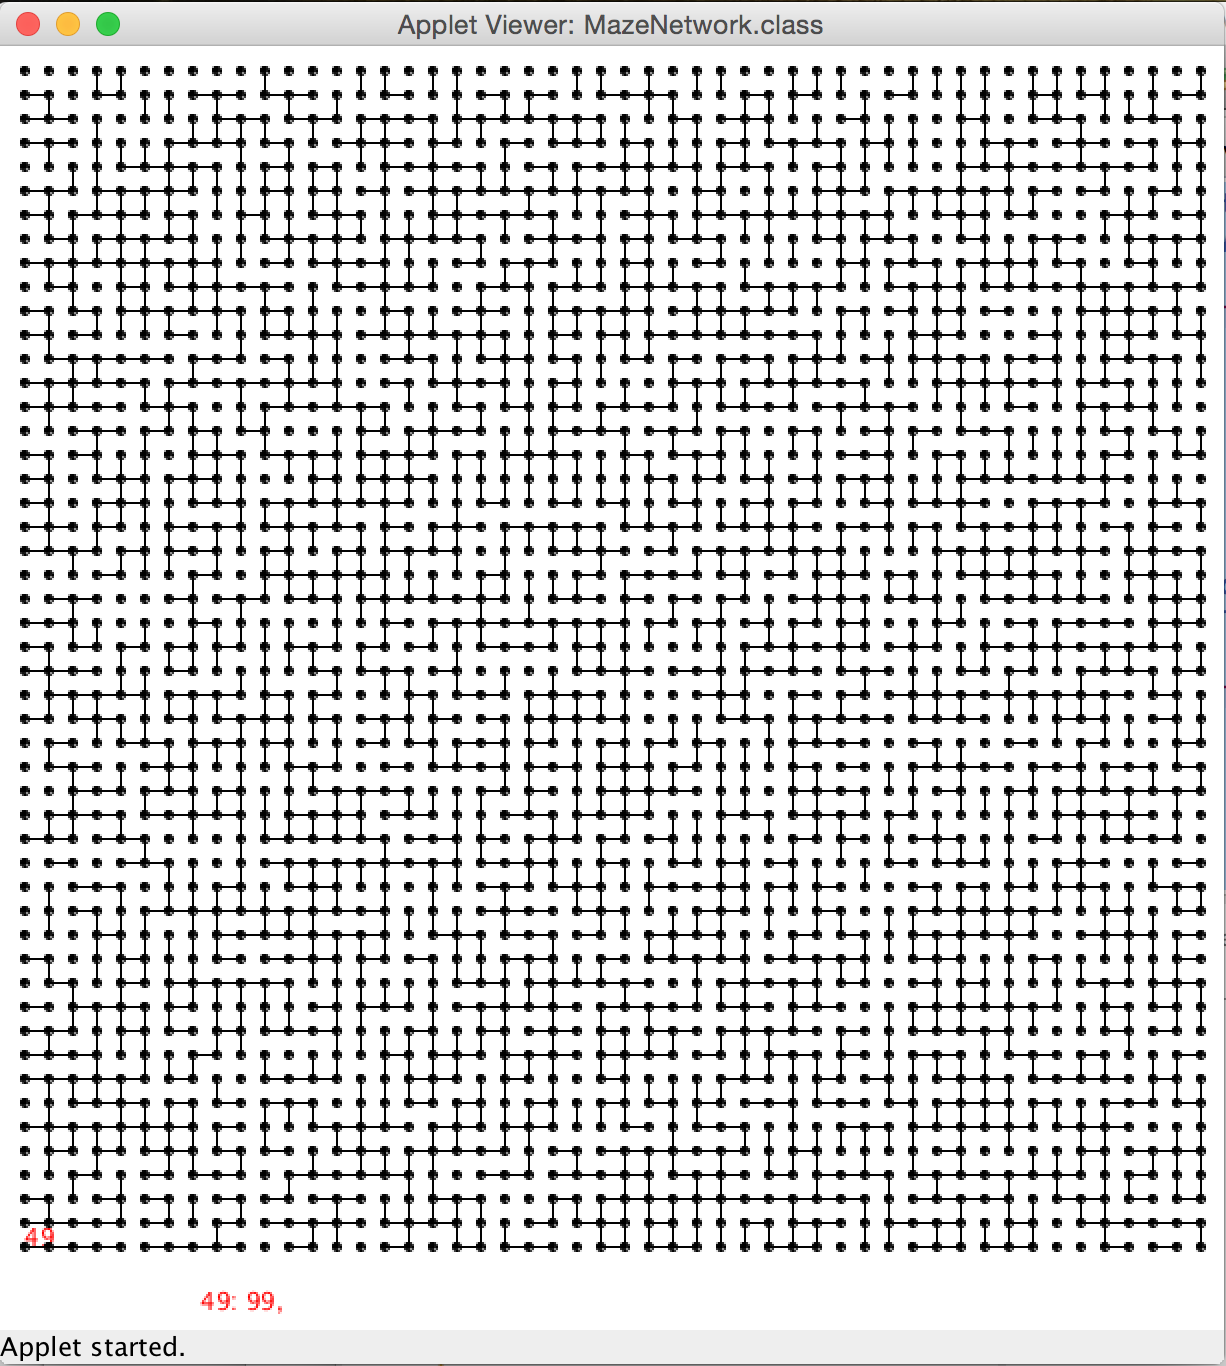
- Run it. Play with the applet to understand how it works.
Explore the Code
The Model
- Read the code for the model. Notice that it contains the bare definition of a graph, its vertices, and its edges, and not much else. That's what a model should contain.
- Look at the main public methods. They are few. They mostly allow one to
- initialize a graph, if we want one already made.
- add an edge
- get the dimension of the grid
- get the adjacency list of a vertex
- Change the probability100 variable; it controls the probability of creating an edge between a vertex and its neighbors. Its value should range between 0 and 100. The lower the value, the less connected the graph is. The closest to 100, the more fully interconnected the vertices get. Run the applet again to see how connected or disconnected your grid becomes.
- Change the maxNoVerticesRows and maxNoVerticesCols which define the number of rows and columns of the grid to something different. Say 40, 60. Or 60, 100. Notice that the visualization will match the new geometry.
The Controller
- Read the code of the controller.
- Notice that the most important action it performs is to set up relationships between the three components, controller, model, and viewer. This way the viewer can call methods of the controller or model, if needed, and similarly for the other two.
- the setVertexUnderMouse() method is a call-back method called by the viewer whenever the mouse is over a vertex. It is a way for the controller to be made aware (by the viewer) that the mouse pointer is over a vertex, and to make something happen. In this case, the controller instructs the viewer to display the vertex number next to the mouse pointer, and to display its adjacency list at the bottom of the applet. The viewer should not really be the one deciding what to do. The controller is the one that should decide.
The Viewer
- Read the code of the viewer. It is the most complex of the three.
- It is the main entry point of the application. That's the class that starts it all.
- The two important methods are:
- setup(): it is called first, once. Its purpose is to
- start the controller first. The controller will get the model to setup the graph, with its geometry.
- the controller gets the model to initialize the graph
- the geometry of the applet is setup so that it will match the grid structure of the graph
- draw(): it is called repeatedly, over and over, about 30 times a second. This is what inheriting from the PApplet class does for us, automatically.
- The other methods are used to locate vertices on the canvas of the applet, or to figure out if the mouse is over a vertex.
