Difference between revisions of "CSC111 Lab 11 2015b"
(→Quadrants) |
(→Moodle Submission) |
||
| Line 65: | Line 65: | ||
* Submit your digitizer tool to Moodle. | * Submit your digitizer tool to Moodle. | ||
* You will not be able to evaluate the tool, as it uses the graphics library, which Moodle does not know how to handle. But make sure your tool can be run if needed. Incomplete programs, or programs that crash will be given a failing grade. | * You will not be able to evaluate the tool, as it uses the graphics library, which Moodle does not know how to handle. But make sure your tool can be run if needed. Incomplete programs, or programs that crash will be given a failing grade. | ||
| − | * Submit a | + | * Submit a copy of the CSV file generated by your tool. |
<br /> | <br /> | ||
<br /> | <br /> | ||
Revision as of 12:38, 15 November 2015
--D. Thiebaut (talk) 10:50, 14 November 2015 (EST)
A Map Digitizer App
The purpose of this lab is to crowd-source a CSV file that will be used in the homework to create a color-coded map of the Smith College buildings, along with
other map elements of your choice.
We will view the program that you create in this lab as a tool used to create data in a well-defined format. The program you will create in the homework will be more sophisticated, and we will refer to it as an application, which will deserve closer attention to details.
The due date for submitting the lab is, as usual, Friday at 11:55 p.m. (11/20/15).
Contents
Lab Assignment
Your task today is to create a Python tool that:
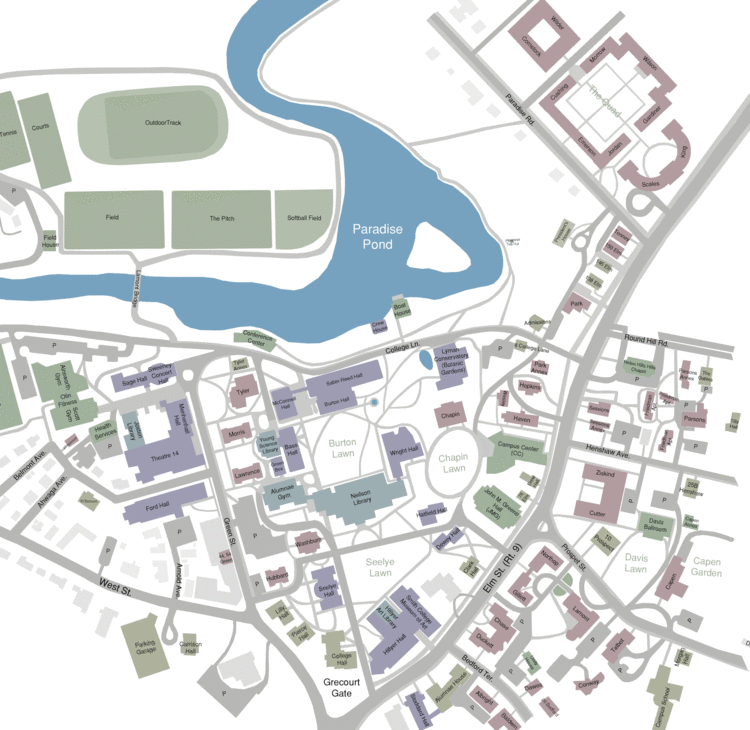
- loads up a gif image representing the Smith College campus. The map can be found below. You’ll have to click on it twice before it appears by itself in your browser, at which point you can save the image to your computer.
- The tool creates a user interface (UI) with one or several buttons. The buttons will allow the user to clearly define the action of digitizing an element of the map. You are free to define how your buttons operate. A possible option is to have a Start and Stop button, but you may want to define your UI differently.
- When the digitization starts, your tool will
- prompt the user for the name of the map element you are about to digitize (e.g. "Tree", "Ford Hall"), and
- allow the you and your partner to record the coordinates of several points in a list.
- Upon indicating to your tool that the collection of the given item is over, it will store each list of points in a CSV file.
- The format of your CSV file should be the format that we will have selected in class (Monday/Wednesday lectures)
- Once you have recorded a sufficient number of map elements, stop the tool, and copy/paste the contents of your CSV file to the shared Google doc we’ll use for this LAM.
GIF Image for Digitizer
Quadrants
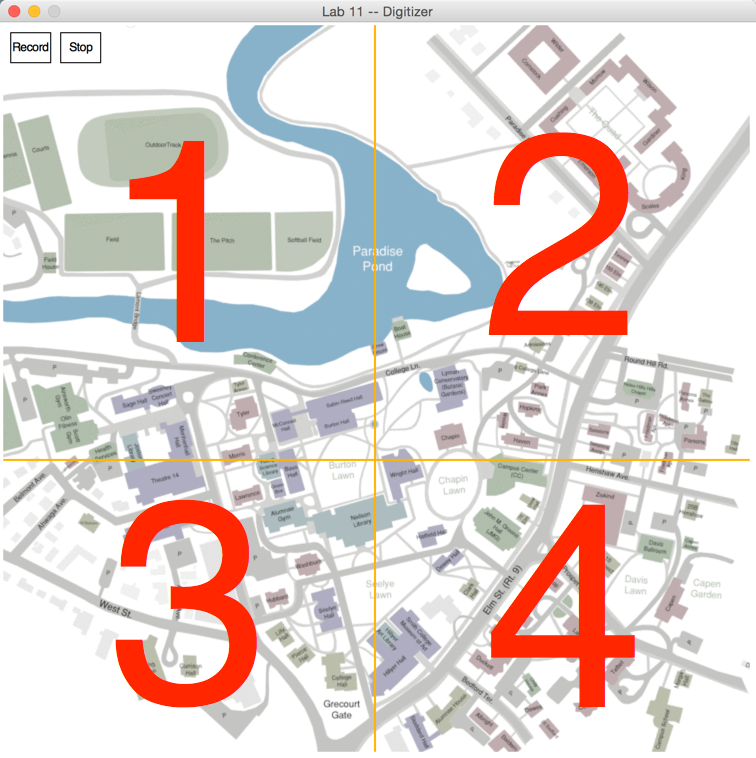
- The figure above divides the map into 4 quadrants.
- The Wed 1-3 group will digitize map elements from Quadrant 1.
- The Thu 1-3 group will digitize map elements from Quadrant 2.
- The Thu 3-5 group will digitize map elements from Quadrant 3.
- The last group will digitize map elements from Quadrant 4.
FYI, the quadrant lines are generated as follows:
    # draw quadrant lines (for lab only)
    line1 = Line( Point(0, 6*HEIGHT//10 ), Point( WIDTH, 6*HEIGHT//10 ) )
    line1.setWidth( 2 )
    line1.setOutline( "orange" )
    line1.draw( win )

    line2 = Line( Point(WIDTH//2, 0), Point( WIDTH//2, HEIGHT ) )
    line2.setWidth( 2 )
    line2.setOutline( "orange" )
    line2.draw( win )
Reference
- The PDF for all the graphics objects in Zelle's graphics library can be found here.
Moodle Submission
- Submit your digitizer tool to Moodle.
- You will not be able to evaluate the tool, as it uses the graphics library, which Moodle does not know how to handle. But make sure your tool can be run if needed. Incomplete programs, or programs that crash will be given a failing grade.
- Submit a copy of the CSV file generated by your tool.
<showafterdate after="20151121 00:00" before="20151231 00:00">
Solution Program
# Lab12_solution.py
# D. Thiebaut
# Solution program for Lab 12.
# This program allows one to digitize several elements of
# a map of the campus, which already contains several elements
# such as buildings, roads, parkings, and rivers.

from graphics import *

# Global variables
WIDTH = 750
HEIGHT = 730
CSV = "lab12map.csv"
MAP = "SmithMap0.gif"

class Button:
    """Implements a button, which contains a label (text),
    is rectangular (frame), and can be clicked (True) or not clicked."""

    def __init__(self, x1, y1, w, h, text ):
        """constructor: pass (x,y) of top left corner,
        and width and height.  Pass the text displayed in
        button."""
        p1 = Point( x1, y1 )
        p2 = Point( x1+w, y1+h )
        self.frame = Rectangle( p1, p2 )
        self.frame.setFill( "white" )
        self.label = Text(Point( x1+w//2, y1+h//2 ), text )
        self.clicked = False

    def draw( self, win ):
        """display button on window."""
        self.frame.draw( win )
        self.label.draw( win )

    def isClicked( self, p ):
        """Checks if p is inside the frame of the button.  Returns True
        if p inside frame, False otherwise.  If p inside, button
        changes state and color."""
        x1, y1 = self.frame.getP1().getX(), self.frame.getP1().getY()
        x2, y2 = self.frame.getP2().getX(), self.frame.getP2().getY()

        if x1 <= p.getX() <= x2 and y1 <= p.getY() <= y2:
            self.clicked = not self.clicked
            if self.clicked:
                self.frame.setFill( "yellow" )
            else:
                self.frame.setFill( "white" )
            return True
        else:
            return False

#---------------------------------------------------------------
# Functions
#---------------------------------------------------------------
def recordPointsToCSV( listPoints ):
    """records the list of points in a CSV file.  The points
    are graphics points, as defined in the graphics library."""
    global CSV # the file name

    # open the file and append to the data already in it
    file = open( CSV, "a" )

    # store additional information at the front of each line
    # according to the decision made in class
    s = "building, 11/14/15, DT,"
    for p in listPoints:
        x = p.getX()
        y = p.getY()
        s = s + "{0:1}, ".format( x )
        s = s + "{0:1}, ".format( y )
    s = s[0:-2] # remove last comma
    file.write( s + "\n" )
    file.close()

def displayPolygonBack( win, listPoints ):
    """ given a list of graphic points, display the
    polygon associated with the points. Color set to
    light-blue.  Provides feedback to user.
    """
    p = Polygon( listPoints )
    p.setFill( "lightblue" )
    p.draw( win )

def main():
    """The main interactive function.  Declare the graphic
    window, populate it with a map and 2 buttons, and allows
    the user to enter different polygons."""
    global WIDTH, HEIGHT, MAP

    # create graphic window.  make it the size of the map.
    win = GraphWin( "Lab 12", WIDTH, HEIGHT )

    # display background image
    map = Image( Point( WIDTH//2, HEIGHT//2 ), MAP )
    map.draw( win )

    # create 2 buttons to start recording and record points to
    # csv
    record = Button( 10, 10, 40, 30, "Record" )
    record.draw( win )
    stop = Button( 60, 10, 40, 30, "Stop" )
    stop.draw( win )

    # create an empty list of points
    listPoints = []

    # animation loop
    while True:
        # has user clicked on a point?
        clickedPoint = win.checkMouse()

        # no, do nothing, keep checking
        if clickedPoint == None:
            continue

        # yes, mouse clicked.

        # was it on record button?
        if record.isClicked( clickedPoint ):
            listPoints = []
            continue

        # no.  Was it on stop button?
        if stop.isClicked( clickedPoint ):
            # yes, record points accumulated and display
            # polygon for feedback.
            recordPointsToCSV( listPoints )
            displayPolygonBack( win, listPoints )
            listPoints = []
            continue

        # no.

        # if we're here, it's because the user clicked
        # outside the buttons, and we should record the
        # point in the list.
        listPoints.append( clickedPoint )


    # We currently will not reach this point, as there is
    # no way to escape the while loop.  A good idear would be
    # to add an exit button.
    win.getMouse()
    win.close()

main()
</showafterdate>

