CSC111 Lab 7 2015
--D. Thiebaut (talk) 11:09, 8 March 2015 (EDT)
In this lab you will play with a graphics library that will allow you to draw simple shapes on the screen.
Setup for Graphics
Step 1: Download the graphics.py Library
- Copy/Paste the code from this page to Idle and save it in the directory where you will save your programs for Week 7, under the name graphics.py.
Step 2: Testing your installation
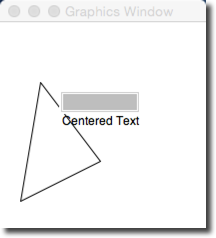
- While graphics.py is in your Idle window, simply click run to run the library. Normally libraries are not run by themselves, but this library has its own test program to help users verify that the library is working properly.
- If everything goes well, you should see this simple window appear on your screen:

- Click a few times on the window and verify that the window responds by changing the color or size of various graphic objects.
Graphics programs have to be run from Idle to work correctly, and need the graphics.py library distributed by Zelle, the author of our textbook.
Step 3: A simple Graphics Program
- Create a new program and call it lab7.py.
- Important: save your program in the same directory/folder where you saved the graphics.py library.
- Copy the code below in it.
# lab7.py
# your name
# draws a circle in a window that is 600x400.

from graphics import *

def main():
    win = GraphWin("My Circle", 600, 400)
    c = Circle(Point(50,50), 10)
    c.draw(win)
    win.getMouse() # Pause to view result
    win.close()    # Close window when done

main()
- Run the program. Verify that you see a single circle in the graphic window.
- Click with the mouse on the graphics window to close it.
Step 4: Explanations
- Observe the program from Step 3 above and recognize the main features:
- First we open a new graphic window on our desktop with the win = GraphWin( ... ) statement. 600 and 400 define how wide and high the window will be. "My Circle" is the title that will appear at the top of the window.
- Next, we create a circle object with the statement c = Circle( Point(50,50), 10 ). This does not draw the circle. It simply creates one in memory, centered on the point of coordinates 50, 10, with a radius of 10.
- Once the circle is created in memory, we make it appear on the graphic window with c.draw( win ).
- Finally, we wait for the user to click on the graphic window, and then close the window.
Step 5: Modifications
- Modify your program, using the code shown below:
# lab7.py
# your name
# Uses graphics.py from Zelle
#
# This program displays a red circle, a label
# and a rectangle.
from graphics import *

def main():
    #open the graphic window.
    win = GraphWin( "Lab 7 Demo", 600, 400 )

    # create and draw a red circle
    center = Point( 100, 100 )
    circ = Circle( center, 30 )
    circ.setFill( 'red' )
    circ.draw( win )

    # add a label inside the circle
    label = Text( center, "red circle" )
    label.draw( win )

    # create and draw a rectangle
    rect = Rectangle( Point( 30, 30 ), Point( 70, 70 ) )
    rect.draw( win )


    win.getMouse() # Pause to view result
    win.close()    # Close window when done

main()
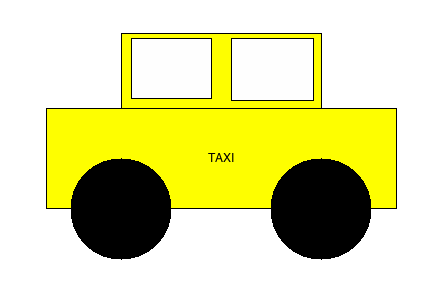
- Using this new bit of knowledge of graphic commands, could you generate the figure below? Note that the graphics system used here can recognize many different colors, all defined by strings, such as 'red' used above. You can find all the available colors on this page.

