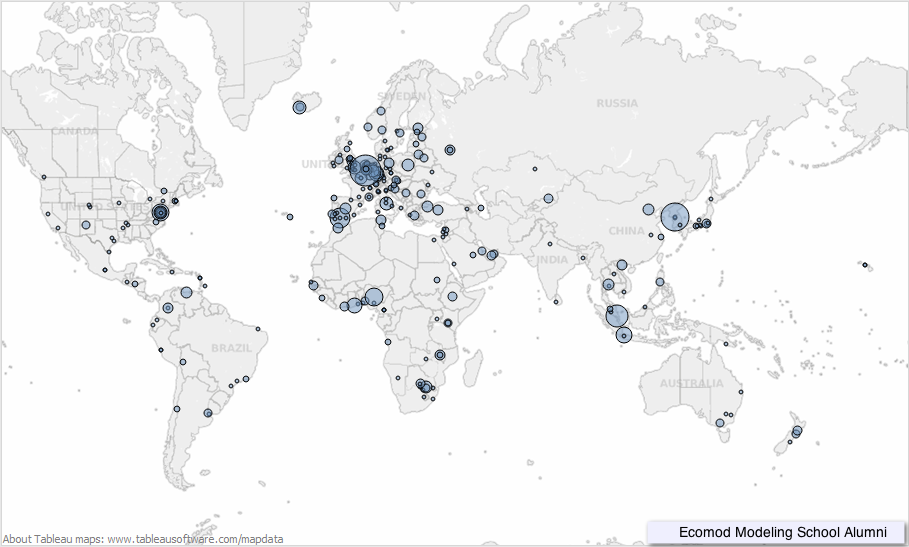
Geo-Mapping Data using Tableau
--D. Thiebaut 09:56, 26 March 2013 (EDT)
This is a series of (quick) steps taken to generate a geographical representation of a list of countries appearing in a CSV-formatted file (comma-separated values). The Tableau software package is used to display the map. The representation associates to each country the number of lines in the file that contain that country. For example, if the country "Belgium" appears 100 times in the CSV file, the value 100 will be associated with Belgium, and the darkness of the color used to show the country will be chosen to show the intensity of 100 compared to the most cited country. Some Python code is used to generate the HTML/Javascript code. See the Geo-Mapping with Google Charts tutorial for an alternative way of displaying the data. The advantage of Google Charts is that you get the javascript code which you can directly imbed in your HTML files for interactive graphics.
Contents |
|
The Data
The data generated was generously shared by Ecomod. It represents the dump of an eXcel spreadsheet in CSV format, and is shown in this page.
