Tutorial: Profiling Java Programs
--D. Thiebaut (talk) 15:01, 30 September 2013 (EDT)
This tutorial is intended to give a brief overview of JVisualVM, the profiler for Java. We use this profiler with Eclipse and use a 2D-packing application as our target application. Our goal is to figure out where the program is spending most of its time. The environment used to create this tutorial is VisualVM 1.3.6 running on OS X 10.7.5, and the hardware is a 2.8 GHz dual quad-core MacPro.
Contents
VisualVM
- On some system Java VisualVM is already part of the installed software, so test first if you have it. It is sometimes in the Applications folder under Java VisualVM, or sometimes it starts in the Terminal with the command jvisualvm.
- VisualVM can be downloaded from visualvm.java.net. Once you have downloaded and installed it, you should be ready for running the application.
- The documentation for VisualVM is available here.
The Packing Application
- The packing application we are going to use for this tutorial is a Processing application. The YouTube movie below illustrates how it proceeds at packing randomly sized rectangles into a larger rectangle.
- Setup the packing application either as an Eclipse project, or using the Processing IDE. If you are using Eclipse, do not forget to include the core.jar as an external library in your Build Path.
- Run the application (or watch the movie) and observe that the application starts quite fast, but slows down significantly. One factor is the fact that the list containing the random rectangles is sorted by decreasing area, and the algorithm picks them largest first, smallest last. So as the algorithm progresses with the packing from left to right, it packs smaller and smaller rectangles and the right frontier advances more slowly than at first.
The second reason is that there is potentially some bottleneck in the program. VisualVM should allow us to look at different aspects of the program.
Starting Monitoring the Processing/Java Application
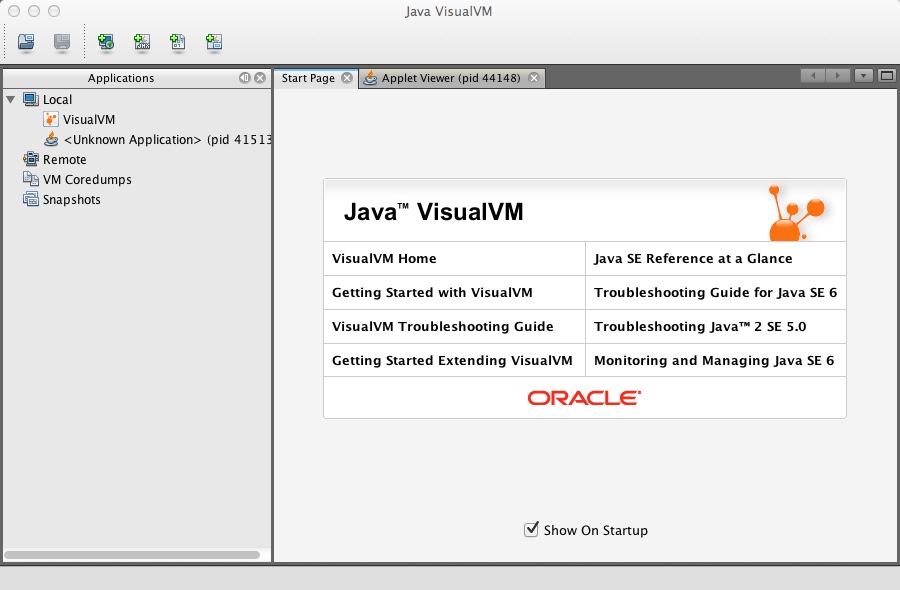
- First start Java Visual VM.
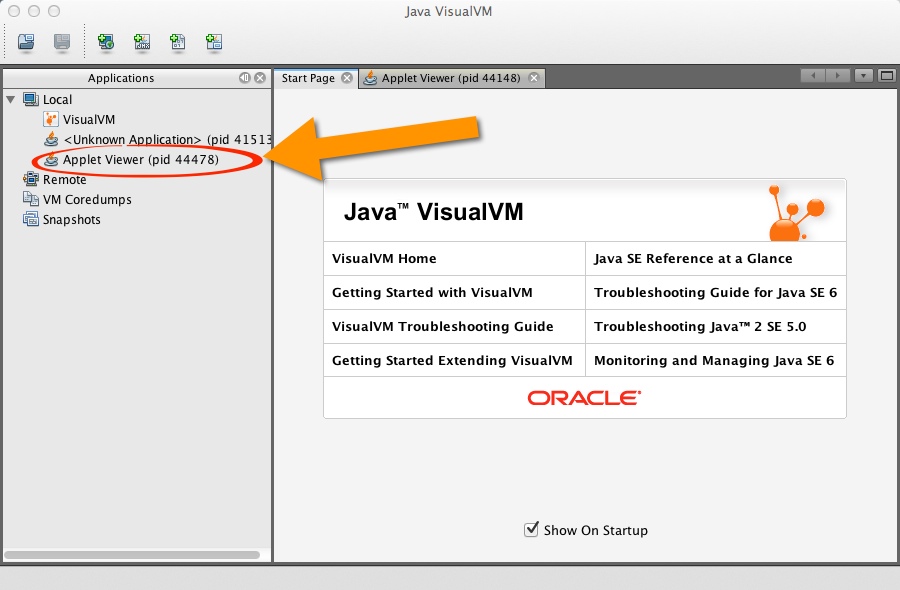
- Start your packing application. In our case we are starting it from Eclipse. As soon as the applet opens and fills up with purple rectangles, a new entry appears in the Java VisualVM window:
- Click on the new entry, and in the right panel click on Monitor:
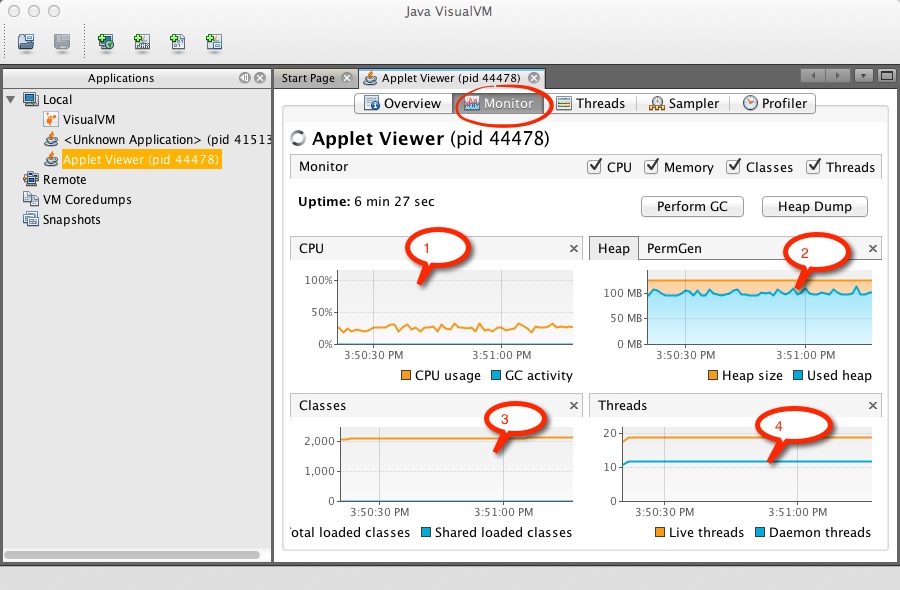
- The monitor window presents you with 4 different charts
- CPU (1)
- The CPU chart incates the CPU usage. The documentation is not clear as to what this means on multicore machines. But in the figure above the 30% or so usage seems to indicate the utilization on 1 core. The blue line that overlaps the x-axis is the Garbage Collector, or (GC). If this line is ever growing above the x-axis, it will indicate that your application is creating a lot of objects that it leaves behind, and the GC is busy cleaning up after the application.
- Heap (2)
The Heap graph shows the amount of heap (memory available for dynamic objects) available (in orange) and used up (in blue). If the blue line is very close to the orange one, your application is filling up the heap with objects. You may have a leak in your program.
- Classes (3)
- This is the number of different loaded classes your application uses. You may think that your application is using much fewer classes, but actually all the libraries and imported classes you use in your program contribute to about 2,000 definitions. The number of objects created by your application can easily range in several tens of millions.
- Threads (4)
That's the number of all threads running while your application runs. The packing application has only 3 threads: the main application, the GUI thread, and the packing thread. However, almost 20 live threads are running while the application is on-going.
StackOverflow has interesting answers to the question a programmer asked about "why so many threads!?"
Viewing Threads
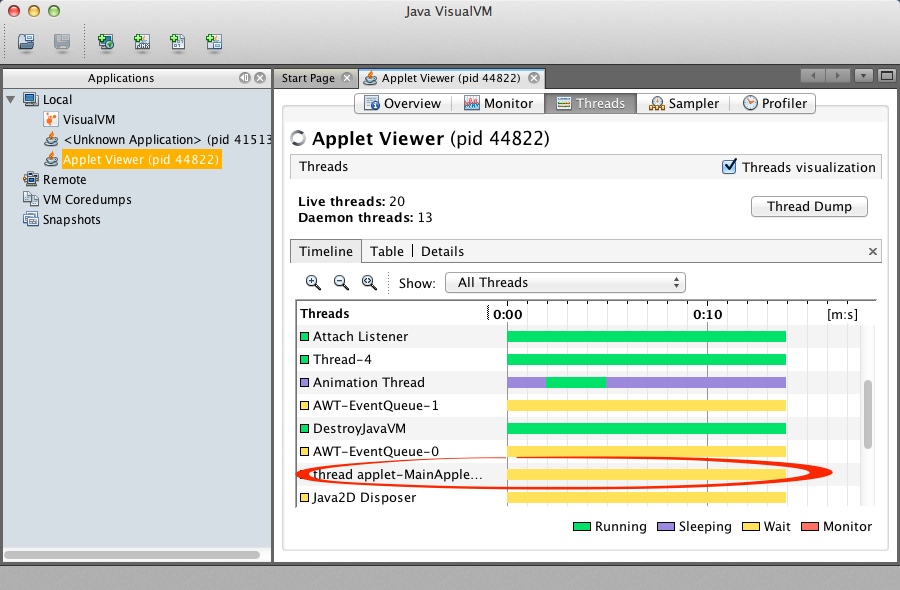
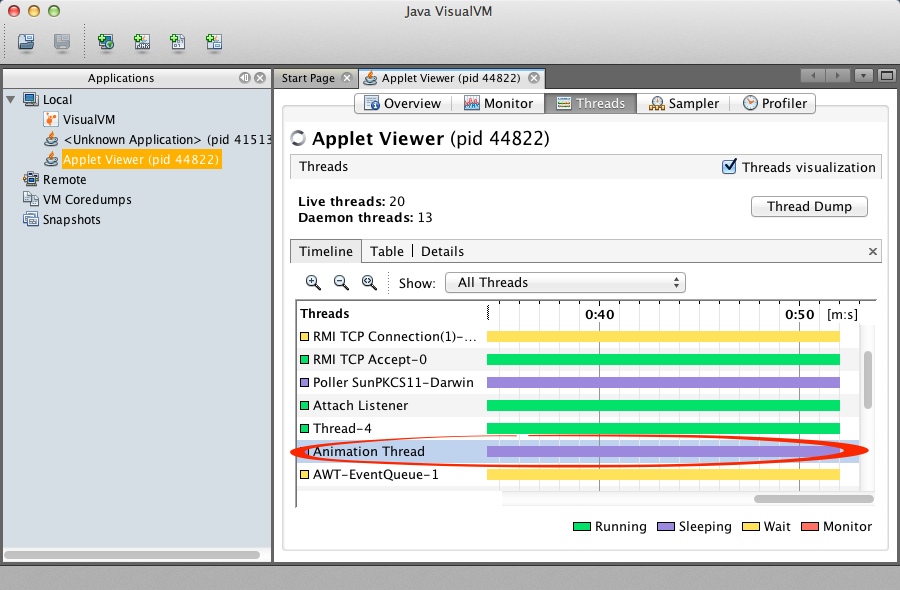
- the thread tab shows the diffrrent threads running, waiting, dead. You can easily spot the Main Application Thread and the GUI thread. Our packing thread is harder to spot. But it should be green, as it is running all the time...
References