Csc334 DT Notes
Notes taken by DT
--Thiebaut 00:33, 8 July 2008 (UTC)
Contents
Source
Bioinformatics for Dummies
Background
- Bioinformatic tools (p. 27) mainly fit in 3 categories
- Sequence alignment
- Phylogenetic and classification methods
- Display tools
- Some bioinformatic tasks (could be labs)
- finding which genomes are available
- analyzing sequences in relation to specific genomes
- displaying genomes
- ORFing: parsing a microbial genome sequence
- GenScan: parsing a eukaryotic genome sequence
- finding orthologous and paralogous genes
- finding repeats
- where to find protein sequences?
- PubMed, but can be confusing
- ExPASy (created by Aimos Baroch)
- The FASTA Format:
>  description line
ACGTTTAGGGCTTTAAAA
AAAGGGTCGATTATTTTA
Aligning Sequences
- Use BLAST.
- Find paper explaining why aligning sequences can be useful. (from http://en.wikipedia.org/wiki/Sequence_alignment )
- From Wikipedia entry on BLAST
- Examples of other questions that researchers use BLAST to answer are:
- Which bacterial species have a protein that is related in lineage to a certain protein with known amino-acid sequence?
- Where does a certain sequence of DNA originate?
- What other genes encode proteins that exhibit structures or motifs such as ones that have just been determined?
- Examples of other questions that researchers use BLAST to answer are:
- Non-biological uses ( from http://en.wikipedia.org/wiki/Sequence_alignment#Non-biological_uses )
- The methods used for biological sequence alignment have also found applications in other fields, most notably in natural language processing. Techniques that generate the set of elements from which words will be selected in natural-language generation algorithms have borrowed multiple sequence alignment techniques from bioinformatics to produce linguistic versions of computer-generated mathematical proofs.[19] In the field of historical and comparative linguistics, sequence alignment has been used to partially automate the comparative method by which linguists traditionally reconstruct languages. Business and marketing research has also applied multiple sequence alignment techniques in analyzing series of purchases over time.
DNA Sequences and statistics (Chapter 5)
Many stats are important for DNA sequences:
- percentage of G-C bases
- percentage of 2-tuple, 3-tuple, 4-tuple, etc...
- counting long words
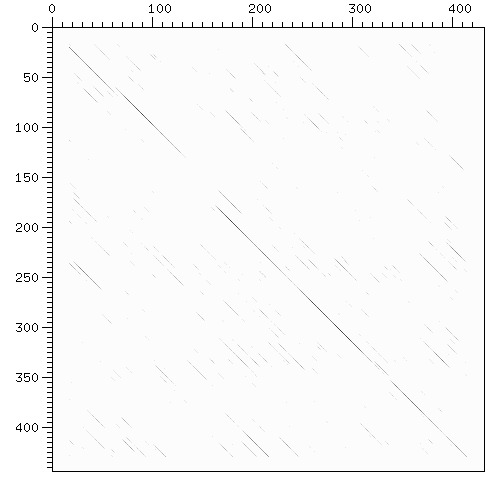
- finding and displaying internal repeats. http://freelancingscience.com/2008/01/24/visualization-of-internal-repeats-in-proteins-or-dna/
- ORFing: requesting that some number of nucleotides appear between a start and stop sequence
- Assembling sequences: given a series of sequences, find the way in which the end of one overlaps with the beginning of another.
Processing.org
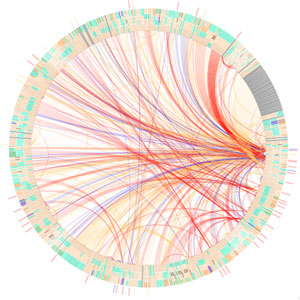
- E-Coli Art
Taken from the Processing Blog. Indicates that
Genetic networks maps are being created at MediaLabMadrid. Also, Jenn Gardy is doing similar work over at The Brinkman Lab at SFU (but I couldn't find anything worthwhile...)
References/Papers
- [1] BLAST Sequences Aid in Genomics and Proteomics, by Dr. Richard M. Casey Published: October 11, 2005
- The Basic Local Alignment Search Tool (BLAST) is one of the most well-known and widely used bioinformatics tools available. Many experts agree that BLAST, as well as its many variants, is used by more scientists than almost any other bioinformatics application. It is popular since gene and protein sequences are fundamentally important in molecular biology, evolutionary biology and drug discovery. BLAST is an ideal tool for analyzing these sequences.
- This article will quickly examine BLAST and the key issues surrounding its use in sequence analysis.
- [2] Volcanic blast recorded in DNA, Jonathan Amos, BBC News Online science, 3 October, 2003
- The tortoises on the slopes of Alcedo Volcano in the Galapagos Islands have the signature of an ancient eruption written in their DNA, scientists say.
- [3] Visualization of internal repeats in proteins (or DNA)
- [...] there are proteins where internal repeats are separated by other domains or repeats, which can result in a real mess (or in scientific language: mosaic-like architecture). When couple of months ago I looked for some visualization method that would allow me to have a quick overview of internal structure of such proteins, I’ve stumbled across The Shape of Song - visualization method developed by Martin Wattenberg, researcher at IBM. This fitted my requirements so I’ve implemented it with some help of Processing (and which I’ve added later to a protein analysis server that has a chance to be published next month). Resulting visualization is below:


