Tutorial: Playing with the Boston Housing Data
--D. Thiebaut (talk) 16:06, 8 August 2016 (EDT)
Deep Neural-Network Regressor (DNNRegressor from Tensorflow)
This tutorial uses SKFlow and TensorFlow, and follows very closely two other good tutorials and merges elements from both:
- https://github.com/tensorflow/tensorflow/blob/master/tensorflow/examples/skflow/boston.py
- http://bigdataexaminer.com/uncategorized/how-to-run-linear-regression-in-python-scikit-learn/
We use the Boston housing prices data for this tutorial.
The tutorial is best viewed as a Jupyter notebook (available in zipped form below), or as a static pdf (you'll have to retype all the commands...)
- Jupyter Notebook (Unzip before using)
SKLearn Linear Regression Model on the Boston Data
This tutorial also uses SKFlow and follows very closely two other good tutorials and merges elements from both:
- https://github.com/tensorflow/tensorflow/blob/master/tensorflow/examples/skflow/boston.py
- http://bigdataexaminer.com/uncategorized/how-to-run-linear-regression-in-python-scikit-learn/
We also use the Boston housing prices data for this tutorial.
The tutorial is best viewed as a Jupyter notebook (available in zipped form below), or as a static pdf (you'll have to retype all the commands...)
- Jupyter Notebook (Unzip before using)
TensorFlow NN with Hidden Layers: Regression on Boston Data
Here we take the same approach, but use the TensorFlow library to solve the problem of predicting the housing prices using the 13 features present in the Boston data. The code is longer, but offers insight into the "behind the scene" aspect of sklearn.
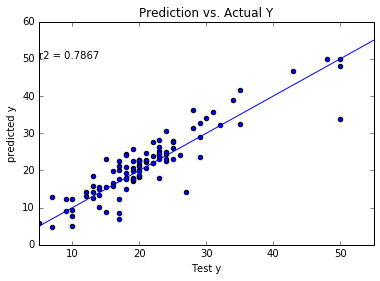
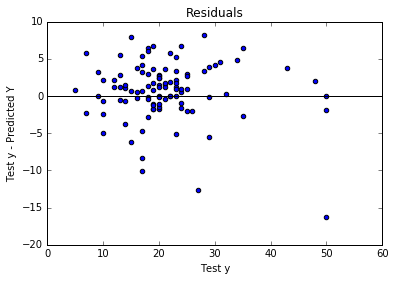
The result is quite good, as illustrated in the figures below, showing prediction versus test data, and residuals. The R2 coefficient of correlation obtained for a network taking 13 features and feeding them into a 52x39x26x13 architecture of layers is R2 = 0.8150.
- Jupyter Notebook (Unzip before using)


