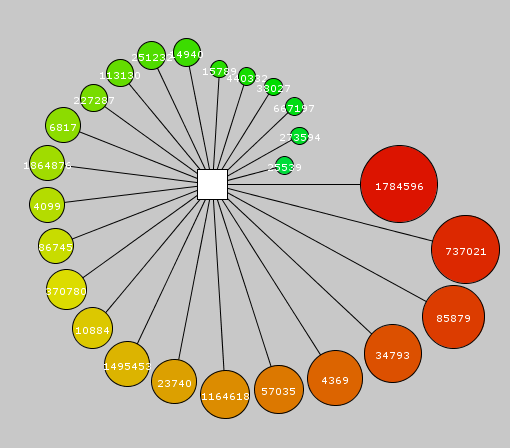
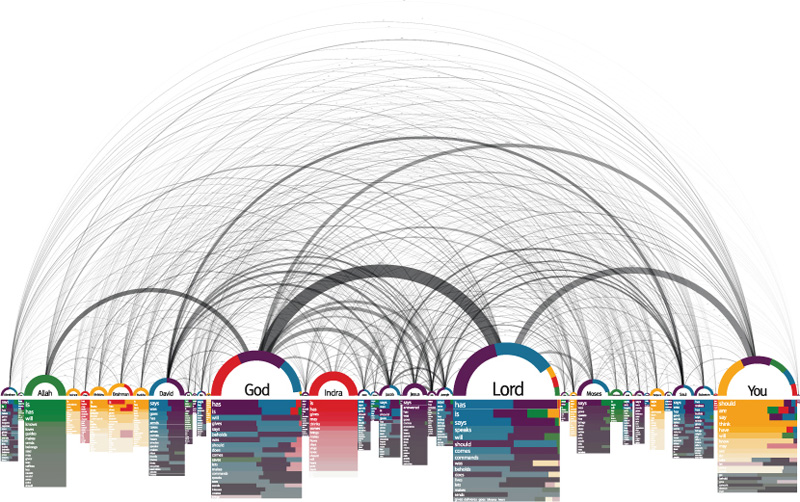
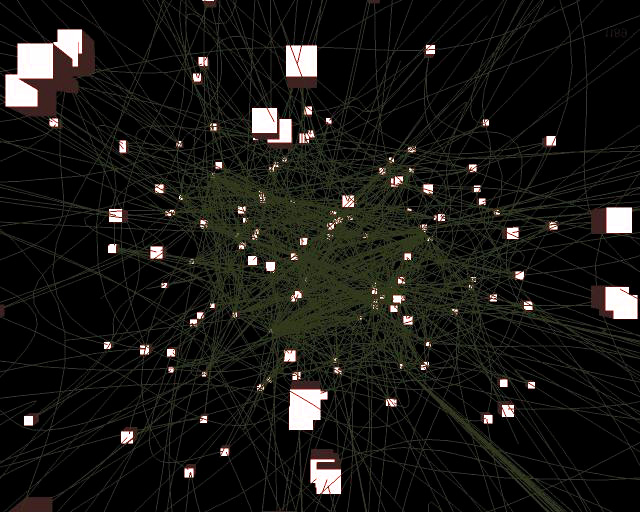
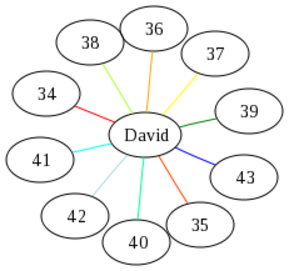
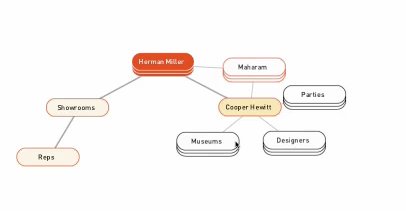
So the final version of this project is almost as interactive as it is meant to be. Due to some unforeseen complications I wasn’t able to implement the functionality that would allow a user to submit the name of a wikipedia page and then have the data about that page displayed. Currently the visualization statically displays the revision information about the page titled “Diebold.” The information about the revisions on the Diebold page is retrieved from a MySQL database and displayed.
The source code is linked on the page at the bottom.
Progress on 4/22! To do for last meeting 4/29…
April 22nd, 2008 by adminA good reference for counting quantities in mysql databases can be
found here:
http://dev.mysql.com/doc/refman/5.0/en/counting-rows.html
Here are some queries that can be useful for getting information
about wikipedia pages and their contributors
- get the page Id of a page with a particular title:
select pageId, title from pages where title like 'Maria Callas';
select pageId, title from pages where title like 'king kong%';
- Use the % sign sparingly, otherwise it will match a lot of stuff we may not be interested in.
- get all the contributors that edited a page with a given PageId:
select Id, revisionId, pageId, contributorId, comment
from revisions where pageId = 10;
- get the number of revisions made by each contributor on a given page with Id PageId (here 1000):
select `contributorId`, count(*) from `revisions` where
         `PageId`=1000 group by `contributorId`;
- get the number of revisions made by each contributor on the page with title “Maria Callas“:
select contributorId, count(*) from revisions where
PageId=( select pageId from pages where title like 'Maria Callas'
limit 1 ) group by contributorId;
Note that the ”’limit 1”’ forces the subquery to return only 1 page-Id. If one
wants to catch all the contributors to all the pages that start with
Maria Callas, then we can try something like this:
select contributorId, count(*) from revisions where PageId in
( select pageId from pages where title like 'Maria Callas%' )
group by contributorId;
Notice the introduction of the keyword in and the %-sign, and the removal of limit 1.
- Be careful, though, this query took several minutes to execute on a 3 GHz Pentium server! This is because there are many pages (20+) with Maria Callas in their title, and for each one we get a list of contributors, then merge all the data together… But it would take longer to do this in Php or Processing, so it pays to make the mysql server do the work. (One way to make the work go faster is to cleverly index the database… I’ll check on whether the indexing of the data can be improved at some point…)
- Finally, we can sort the results by count, so that the most prolific contributors are listed first. This way we can pick only the top N contributors, or only those who contributed more than R revisions.
select contributorId, count(*) as theCount from
         revisions where PageId = ( select pageId from pages where title like
         'Maria Callas' limit 1 ) group by contributorId order by theCount desc;
Note that we give a temporary name to the result of count(*), theCount, so that we can specify what to sort the returned result on.
To Do for next week:
- Start from a string containing the name of a wikipage, say “Maria Callas”, and create a graph with the rectangle in the middle showing the page name, and circles exploding around showing the contributors. Put the contributor Id in the circle. Make the size of the circle or the size of the link proportional to the number of contributions
- Create a table on the side of the graph with statistics about the page. For example, the page title, the total number of revisions, the total number of contributors, and maybe the top contributor.
- Create a mouse-over or a mouse-click event that will display in the status box information about what the mouse is pointing to.
To Do for 4/22/08]
April 21st, 2008 by adminI should have posted it last week, but working from memory, this is what I remember us agreeing upon.
- We want something that may not have the bells and whistles, but that can grab information (a wikipedia page and its contributors) from a mySql database
- Display the page at the center of a Processing graph
- Display the contributors as circles around the page
- Show a measure of the amount of contribution from a contributor to the page (number of lines of edits, for example, or number of times contributor modified the page)
- Have some labeling system so that we can find out what the title of the page is, and who the contributors are. It might be too confusing to have the names inside the circles, so an alternative could be to have numbers in each circle and a table on the side indicating what name is associated with each number.
- Have a clickable map, so that clicking on a contributor could trigger some action such as going to the database and fetching more information, such as all the pages that have been contributed to by this person.
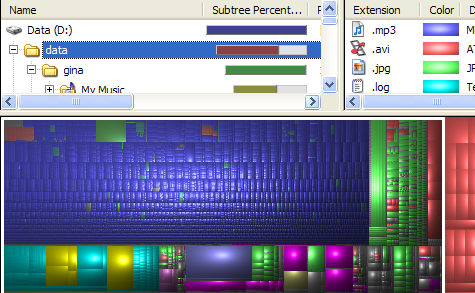
Tree-maps: another interesting visual display of information
April 10th, 2008 by adminFrom http://lifehacker.com/software/disk-space/geek-to-live–visualize-your-hard-drive-usage-219058.php
Development Paused for the Week
April 7th, 2008 by AllieSo while looking at my calendar for the week I realized that this weekend is Collaborations! So instead of doing development I made the poster for Collaborations and had the opportunity to reflect on the different aspects of the project. More and more I’m surprised that there isn’t a large presence of research being done on the subject, especially by Google.
So here is the current poster, which is in need of editing before it goes to the printer.
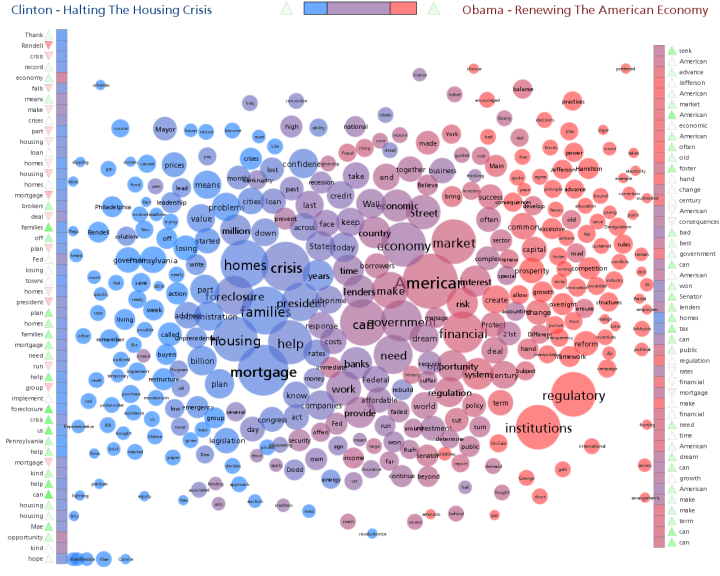
Interesting word chart
April 1st, 2008 by adminhttp://www.neoformix.com/2008/ObamaClintonSpeechContrast.html
Interesting comparison of two speeches…
New version of exploding circles
April 1st, 2008 by adminJust finished going over the code with Allie, and we got a nice smooth display.
Here’s the link
Ideas for what to implement for next week:
- Make the dimensions of the display constant and everything else depends on it. We might want to keep in mind that with some graphs, their might be so many circles that scaling might become important. Check the Processing documentation for how scaling can be done. (Scaling means that the window has a geometry of, say, 500 x 500, but that we are actually using a mathematical world that might be 1000×1000)
- Put all the properties of the circles in arrays. These arrays eventually will be filled by a query to the database. But right now we might want to have an array of strings which will be shown inside the circles, and an array of numbers defining the connectivity of the circle (wikipedia contributor) to the center square (wikipedia page). You might want to use this number to define the color of the circles, the size of the circles, or the width of the edges (or a combination of them).
- Look at ways to make the circles or the square clickable, so that clicking on one will cause the browser to present new information.
- Look at ways to show information on mouse-over events. If the mouse moves over a circle, it would be nice to have a box give more information about this circle.
Geometry is complicated…
March 31st, 2008 by AllieHere are my three latest trials. I was able to implement the circles having text on them but for some reason the text would not show within the web browser. It has to do with how processing renders text and I’m not sure how to get around it.
4 Circles around a Square: Link 1
12 Circles around a Square: Link 2
24 Circles around a Square: Link 3
Some Graphviz Examples
March 30th, 2008 by adminJust found this while looking for ways to represent the CS curriculum as a graph. I think our direction using Processing is good, and I don’t want to go back to Graphviz, but looking at ways people are using graphing packages to show relationships is interesting, no matter what package they use.
http://www.flickr.com/search/?q=graphviz&w=all&s=int
To do for 4/1/08
March 25th, 2008 by adminGood job on today’s applets.
For next week, here is what we are shooting for:
- square in the middle
- 10 circles distributed on a wheel around the center square. They may start all overlapping over the middle square, and quickly move out on the spokes of the wheel to settle at safe distances from the center square and from each other
- the circles have random dimensions
- the circles are connected to the center square by edges
- for speed, we may want to redraw the circles in gray before redrawing them in white to prevent filling the whole background every time.
Fun with Applets
March 24th, 2008 by AllieSo spring break is over, my flu isn’t yet, but I was still able to get all our goals accomplished! There are two examples of applets. The first is with static, overlapping circles and then the second is with moving circles. An unexpected side affect of moving the circles to avoid colliding is that the circles aren’t redrawn a new one is just drawn for every frame. I’m not sure how to fix that just yet. Also after reading the collision avoidance section I just decided to write all my own code. Since I’m currently taking about 120mg of sudafed there is something wrong with my algorithm that makes the circles lock in perpetual motion if they sit right on top of each other. It’s probably an easy fix though.
I would have gone ahead with drawing lines and labels but I wanted to learn how to un-draw the objects first before adding even more visual clutter to the window.
First trial with multiple circles: http://www.cs.smith.edu/~abellew/multipleCircles/
Second trial with moving circles: http://www.cs.smith.edu/~abellew/movingCircles/
To do for 3/25/08
March 11th, 2008 by admin1) study if we can put two circles (ellipses) on a plan, overlapping, and have them move away from each other until they do not overlap. Investigate how much programming is involved, and whether the movement can be automatically controlled by Processing
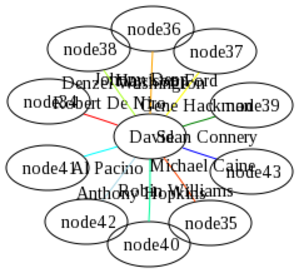
2) Create a “daisy” diagram of a few nodes, with one node in the center of the star, and several nodes around. Each node should have a label, and the nodes are connected to the center node with links/edges of varying width.
3) Figure out how to generate an applet from a Processing program.
A Processing Program
March 11th, 2008 by admin
// ellipses on springs
int ellipses = 5;
float[]x = new float[ellipses];
float[]y = new float[ellipses];
float[]w = new float[ellipses];
float[]h = new float[ellipses];
float[]angle = new float[ellipses];
float[]frequency = new float[ellipses];
float[]amplitude = new float[ellipses];
float[]strokeWt = new float[ellipses];
float[]damping = new float[ellipses];
int springSegments = 24;
int springWidth = 8;

void setup() {
  size(600, 400);
  frameRate(30);
  smooth();
  fill(0);
  setSpring();
}

void draw() {
  background(255);
  for (int i=0; i<ellipses; i++) {
      createSpring(x[i], y[i], w[i], h[i], strokeWt[i]);
      noStroke();
      fill(0);
      // draw ellipses
      ellipse(x[i], y[i], 50, 50);
      // spring behavior
      y[i] = y[i]+cos(radians(angle[i]))*amplitude[i];
      angle[i]+=frequency[i];
      amplitude[i]*=damping[i];
   }
  // press the mouse to reset
  if (mousePressed) {
     setSpring();
  }
}

void setSpring() {
  for (int i=0; i<ellipses; i++) {
    // size approximates mass
    w[i] = random(20, 70);
    h[i] = w[i];
    // stroke weight approximates
    // spring strength (resistance)
    strokeWt[i] = random(1, 4);
    x[i] = ((width/(ellipses+1))*i)+width/(ellipses+1)-w[i]/2.0;
    y[i] = (w[i]*3)/strokeWt[i];
    angle[i] = 0;
    // spring speed
    frequency[i] = strokeWt[i]*4;
    // amplitude based on mass/spring strength
    amplitude[i] = (w[i]*1.5)/strokeWt[i];
    // calculate damping based on stroke weight
    // simulates resistance of spring thickness
    switch(round(strokeWt[i])) {
      case 1:
        damping[i] = .99;
        break;
      case 2:
        damping[i] = .98;
        break;
      case 3:
        damping[i] = .97;
        break;
      case 4:
        damping[i] = .96;
        break;
     }
   }
}

// plot spring
void createSpring(float x, float y, float w, float h, float strokeWt) {
   stroke(50);
   strokeWeight(strokeWt);
   for (int i=0; i<springSegments; i++) {
     // for spring end segment
     if (i==springSegments-1) {
        line(x+w/2+springWidth, (y/springSegments)*i, x+w/2, (y/springSegments)*(i+1));
     }
     else {
       // alternate spring bend left/right
       if (i%2==0) {
          line(x+w/2-springWidth, (y/springSegments)*i, x+w/2-springWidth, (y/springSegments)*(i+1));
       }
     }
  }
}
The resulting applet: [processing/index.html applet]
To do list for 3/11/08
March 4th, 2008 by adminWe are following the Processing path.
From Allie’s exploration of Processing, it seems that we can represent a star graph in 3-D with springs linking the outside nodes to the node at the center of the star, and use non-collision attributes of the nodes to make sure they do not overlap in space. It seems that using a “force field” around the nodes would force them to be some distance away from each other in a pleasing way.
The different ideas we discussed:
- on a mouse-over event over a node, a box opens up with information about the node visited, and a link that can bring up a new page, or a new graph
- we can use the mouse to ‘move’ the graph around and see what is “behind”
- we could have a series of checkboxes, or text input boxes that would allow for interesting filtering of the data:
- We can block all the contributors belonging to the same IP group together (all the contributors working at MS, for example), in one big node
- we can color-tag all the contributors that have a particular status: working at a given company, having contributed in the last week/month, having contributed to other pages
- We could also organize the nodes on some kind of geodesic space around the center node
Processing + PHP
February 25th, 2008 by AllieSo I did a search for “php” within the http://processing.org domain and received a number of interesting results, the most interesting being this forum post about a trick to using php requests for MySQL data.
This post is also interesting (notably Reply #6):
Processing is just the visual framework that will work for this project I think and since now I know it’s possible to connect it to MySQL through PHP we can move ahead! This is very exciting indeed and since it’s already being used in the department it’s a great tool to perpetuate.
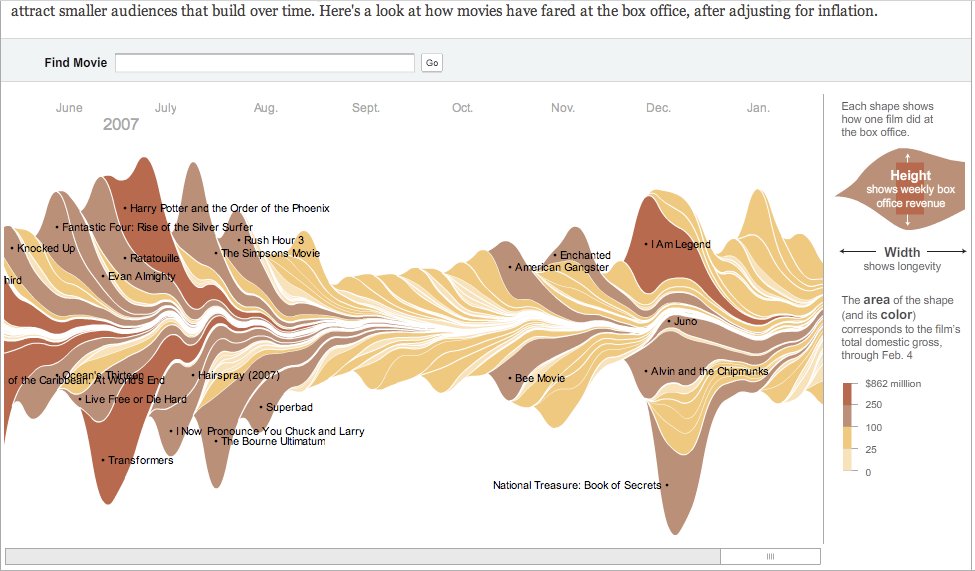
Showing the time variation of various quantities
February 24th, 2008 by adminToday’s NYT (2/24/08) shows an interesting graph of the money made by different movies in 2007. It’s an interesting way to show time-variation of several tens of quantities.
The graph is interactive, as the mouse is moved over the different movies, some information is displayed, as well as the length of their duration. http://www.nytimes.com/February 22nd, 2008 by admin
(Note: I will keep adding more links as the time comes, so please keep checking this post often ![]()
Click here to see an applet in action
Check http://www.processing.org for more info and examples.
Something new to explore!
February 21st, 2008 by adminJust attended a talk today by Ben Fry in the Art Department. Super stuff. Wish you had seen it, Allie.
Ben is the co-author of a language called “processing” (http://processing.org). He showed some very interesting animation and 3-D graphs that seem perfect for what we want to do. The graphics look pretty spectacular. I am not just sure how much coding is behind all the example.
I would like to change the “todo” list for this coming Tuesday and have you explore Processing instead. By the way, Processing is the language used in CSC106, taught by Eitan and Thomas, so several seniors including Jordan and Stephanie might be good people to brainstorm with…
Happy exploring!!!
To do for 2/26/08
February 19th, 2008 by admin- Modify the current display page and remove the frames
- Explore how to get better interaction from the SVG file when we click on nodes
- Aim for our next goal: a form with a box at the top where we can enter keywords (Hillary Clinton, say), and a submit button. Clicking on the button triggers a php program that generates a star graph with Hillary Clinton in the middle and the 10, 20, N most active contributors all around. Somehow we need to convey the scale of the number of edits. Probably a scale on the side (which we won’t worry about making user-modifiable right now), and links of varying width or color (or both) linking the contributors to the center node. The number 10, 20 or N might also be numbers in a text-entry box of the form.
- Clicking on a contributor node will bring up a new graph with this contributor in the center of a star, and the top 10, 20, N pages it has contributed to all around. We’ll probably want to see the “Hillary Clinton” page as part of these 10, 20, N pages, even if its ranking does not place it in this group.
- Explore stored procedures under mySql 5.0… Also, do not hesitate to make mySql do the dirty work, i.e. counting the number of contributors:
select count( `contributorId` ) from `tablex`
where `contributorId`=N and `pageId`=P
How to generate PNG and SVG images of graphs in Php using Neato or Dot
February 19th, 2008 by adminThis does generate PNG and SVG files for directed and undirected graphs.
First, you must login to tango.csc.smith.edu, as Graphviz is only installed on tango, and not on beowulf. Use your regular Linux login information to connect.
Next, cd to /var/www/html/abellew/ to make it your working directory, and create the two subdirectories specified below.
Create a subdirectory in your working directory called Image. Make sure it is world-readable. This directory will contain a Php file containing a php class that takes care of generating png images from various GraphViz commands.
Create another subdirectory called images that is world readable and writable. This is where the Php class will store the png and svg image files.
Copy the file GraphViz.php into the Image subdirectory. It’s the Php class we’re going to use. Make sure it is world-readable.
Create a test file called graphviztest.php in your working directory (of which Image and images are subdirectories). Make sure this file is world-readable as well.
Point your browser to this new address:
http://tango.csc.smith.edu/abellew/graphviztest.php
and verify that you get a page with two pictures of the same graph. The top image is in png, the bottom one in svg. Verify that you can click on the nodes of the svg image and follow links (although they have the bad problem of opening up in the embedded frame, not the whole browser window… File:Icon sad.gif
Example Php program to access wikipedia history
February 19th, 2008 by adminThe following page contains Php code to retrieve pages id from the wikipedia history database, along with the contributors to a page with a given Id. (The page will take several seconds to load as the query is performing a search for keywords in the 11 million pages in the database).
Note that the current version retrieves only the contributors for 1 page, but that with little effort we can change the query to retrieve the contributors to a list of several pages Ids.
In order to run the program you must have a copy of the accessvars.php file, shown below:
<?php
//--------------------------------------------------------------
// MySql variables
//--------------------------------------------------------------
$params = array( 'host'     => "tango.csc.smith.edu",
       'database' => "enwikihistory2",
       'table'    => "pages",
       'user'     => "yourmysqlloginname",
       'passwd'   => "yourmysqlpassword" );
?>
An Interactive Page
February 19th, 2008 by AllieThis week I was able to make a new page with the three specified frames showing the title of the wiki page in the top, the svg in the middle and potential contributor information in the bottom. I was able to give the nodes the appropriate links except that because of the frame structure the links target the frame in which they are clicked instead of a different frame or new window.
I thought about the different ways to create a scale and these were my thoughts:
- There are two ways to go about the scale. The first way is including the scale in the svg and the other is to have the scale live in another part of the webpage.
- If the scale should be part of the svg I’m not sure how to implement it using the DOT language.
- If the scale should be in another part of the webpage then what kind of control should it be? Also, how is it going to communicate with the page creating/running the svg, via PHP, JavaScript or maybe something else?
So I didn’t complete the scale part of this week’s tasks because I bogged myself down with the greater end goals. Also in order to get the correct scale requires a complex SQL Select statement and some post-processing. I looked up some static information in the database and wrote the topmost frame to look some revision information similar to what will be needed for the scale. So while I didn’t get a scale, this is foundation for what will need to be decided/done in the future.
Also in order to keep as many versions of this project as might be helpful I am storing each week’s work in a separate folder denoted by month.day.year so this week’s new work (any pages/code that I edited) is stored here (click on “viz.html”):
http://www.cs.smith.edu/~abellew/2.18.2008
February 17th, 2008 by admin
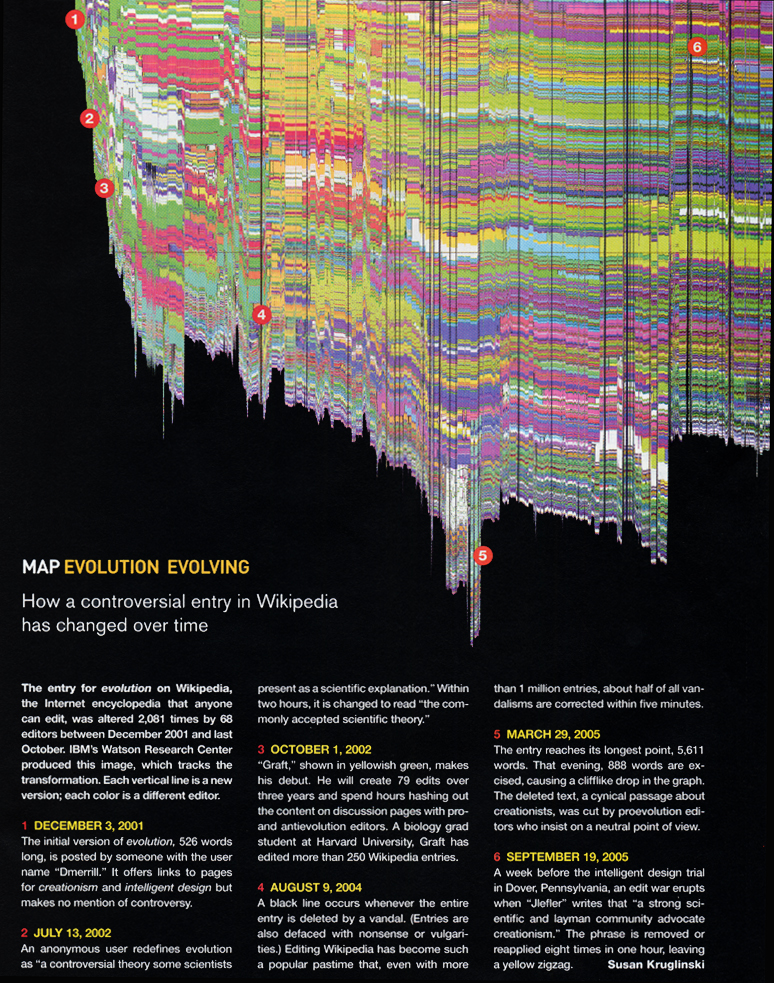
Graphing the history of a wikipedia page
February 12th, 2008 by adminGenerated by Martin Wattenberg and
described in “Studying Cooperation and Conflict between Authors
with history flow Visualizations”, 2004 (link).
35 Great Visualizations
February 12th, 2008 by adminCan be found here: abeautifulwww.com
To do for 2/19/08
February 12th, 2008 by admin- Make SVG clickable with nodes pointing to other pages
- Put SVG in a system of 3 frames, with middle frame showing the svg graph, top slim frame showing a title, and bottom slim frame showing an image from the wikipage (static image for right now). When user clicks on a node, information about this node shows up in bottom frame
- Question: is SVG the only format that allows for interaction with user (clickable)?
- Investigate creating a scale to show what information is represented by the link. If using color, then need a color scale. If using line width as measure of # of contributions, then show a scale with 4 or 5 thicknesses and what # they represent. Use a linear map between # of contributions and thickness for right now.
- Watch Tamara Munzner’s video, and explore her web site and her group’s web site
- Semester-long project: look for turn-key software systems for displaying graphs.
Competition on Visual Network Dynamics
February 12th, 2008 by adminCompetition on visualizing network dynamics
2007, Queens, NY
Some interesting designs for representing large networks.
Must-watch video!
February 12th, 2008 by adminTamara Munzner of U. British Columbia presents a talk at Google titled 15 Views of a Node Link Graph: An Information Visualization Portfolio
http://video.google.com/videoplay?docid=-6229232330597040086 & q=type%3Agoogle+engEDU
It’s one-hour long, but worth it. It would be nice to see if some of the software she demonstrates for exploring graphs is available…
Tamara’s Web site and group’s
site have good information.
Progress on project!
February 11th, 2008 by AllieSo far I have created a hap-harzard couple of Python objects to parse a text file with data in it. I definitely spent more time this week on function rather than commenting but I am guessing most of my work so far will be changed/adjusted as the programming language changes (from Python to PHP) and as the complexity of my task increases. Here is a link to all the files that I worked on/created:
http://maven.smith.edu/~thiebaut/IS_blog/abellew/2.18.2008/
pluginspage=”http://www.adobe.com/svg/viewer/install/” />Html code to embed svg in html:
<embed src="http://www.cs.smith.edu/~abellew/2.12.2008/neatoTrial.svg"
width="600" height="1000" type="image/svg+xml"
pluginspage="http://www.adobe.com/svg/viewer/install/" />
Graph Visualization Specifics
February 11th, 2008 by AllieThe graph visualizer in Silverlight, while supporting physics algorithms to display the graph in the most rigid fashion, we are not interested in rigidity but rather the best way to visually represent the information for extrapolation. Graphviz is the best option for accomplishing that goal.
For the actual graph.. in order to quickly and easily identify which Wikipedia users contributed most to an article I would like to use a color bar from blue (less contribution) to red (more contribution) on the line connecting the user to an article. Using a color scheme like this instead of varying degrees of line thickness is more intuitive for detecting levels of activity.
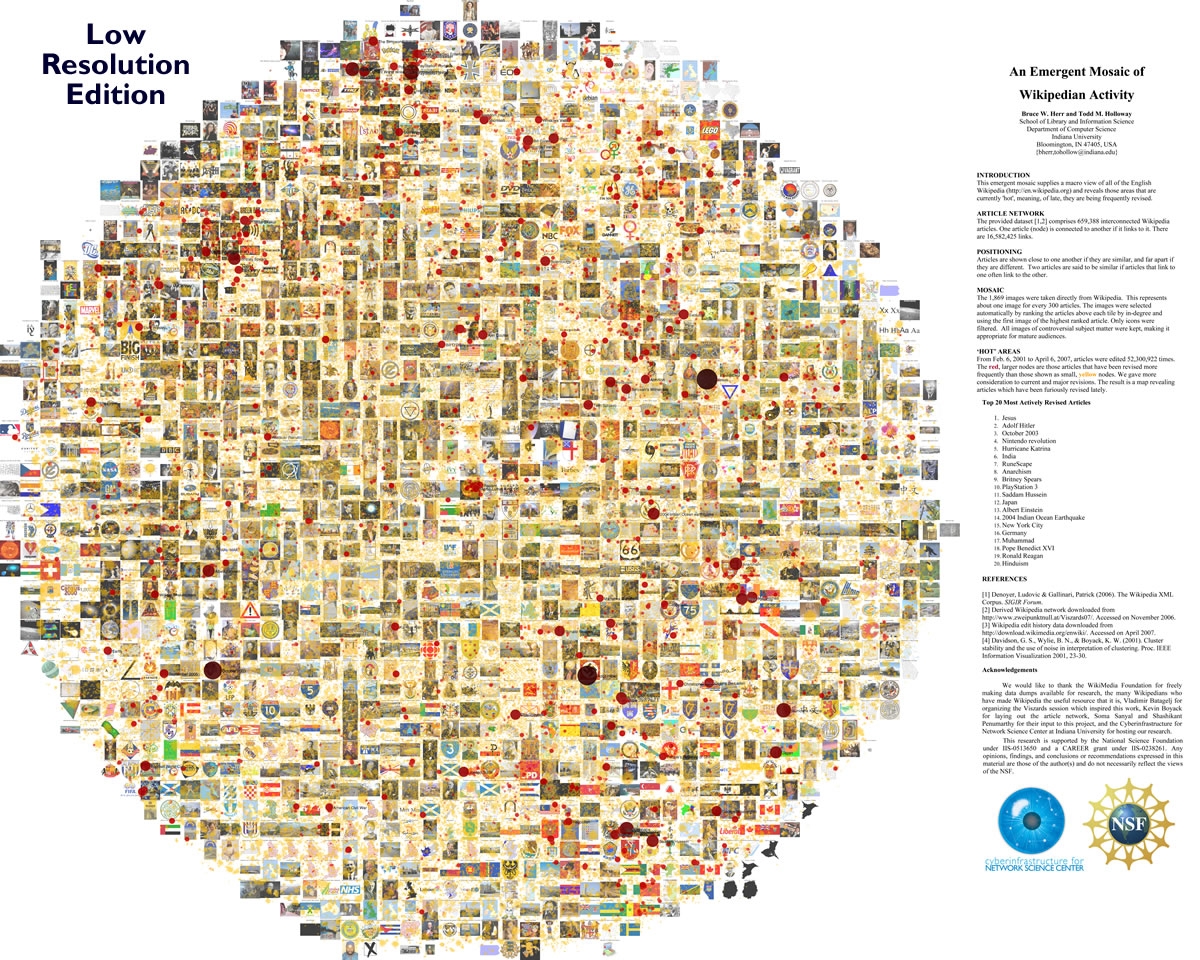
Neat graphical representation of activity in Wikipedia
February 11th, 2008 by adminClick here for full size image.
Very interesting and artistic way to depict activity in the wikipedia pages.
For more information, check Bruce Herr’s http://abeautifulwww.com/2007/05/20/visualizing-the-power-struggle-in-wikipedia/
or “Visualizing the ‘Power Struggle’ in Wikipedia”
A nicer web-2.0 type graph where the user can zoom in and out can be found here:
http://scimaps.org/maps/wikipedia/
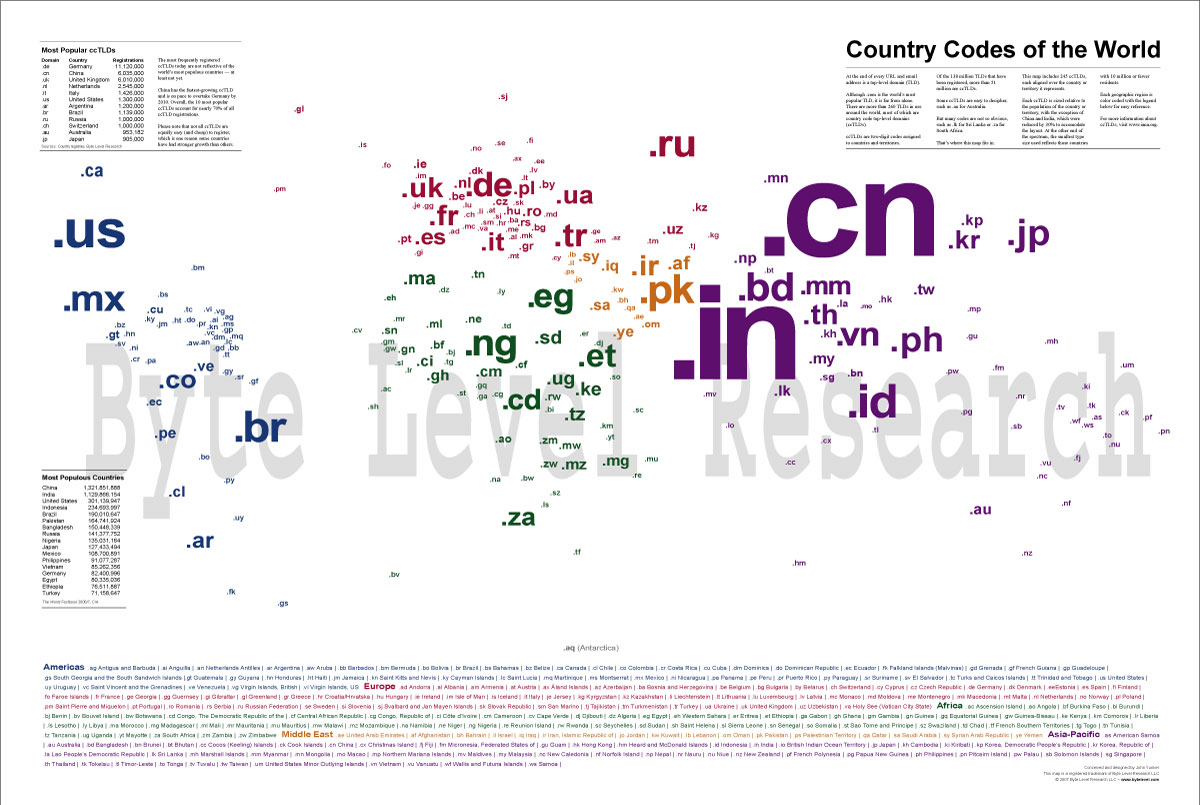
Another nice image representing graphically the geography and activity by domain name
Interesting visualization packages
February 5th, 2008 by adminTo do for 2/12/08
February 5th, 2008 by adminCreate a text file with the following entries
- title of the page (this will be in a circle in the middle of the graph)
- the link to the page (this will be called when we click on the circle)
- a collection of 20 triplets (3-line blocks)
- contributor name
- # of contributions to the current page
- link to the contributor (this will be a link to a php page which will get the Id of the contributor)
Generate from this a dot file
process the dot file to get an svg file
put the svg file on your web site
install the svg plugin for your browser
display the graph
Visual Representation Options
January 29th, 2008 by AllieSo here is a link to Microsoft Silverlight’s “Showcase” page where some Silverlight applications are available for demo. I don’t want to initially create a large web application but Silverlight graphics can be inserted inline with HTML code easily.
http://silverlight.net/showcase/default.aspx
On Borges and Wikipedia
January 29th, 2008 by adminIn 1940, Borges wrote:
Who, singular or plural, invented Tlön? The plural is, I suppose, inevitable, since the hypothesis of a single inventor — some infinite Leibniz working in obscurity and self-effacement — has been unanimously discarded. It is conjectured that this ‘brave new world’ is the work of a secret society of astronomers, biologists, engineers, metaphysicians, poets, chemists, algebrists, moralists, painters, geometers, … guided and directed by some shadowy man of genius. There are many men adept in those diverse disciplines, but few capable of imagination — fewer still capable of subordinating imagination to a rigorous and systematic plan. The plan is so vast that the contribution of each writer is infinitesimal.
Not too bad a description of Wikipedia!
More on this in a 01/06/08 NYT article
Borges and the Foreseeable Future.
Animation of the history of a wikipedia page
January 29th, 2008 by adminHere is a cool link to a page showing an animation of the life of a wikipedia page. This is done by Jon Udell.
- The animation:
http://weblog.infoworld.com/udell/gems/umlaut.html - Some information from the associated blog:
http://waxy.org/archive/2005/06/14/automati.shtml
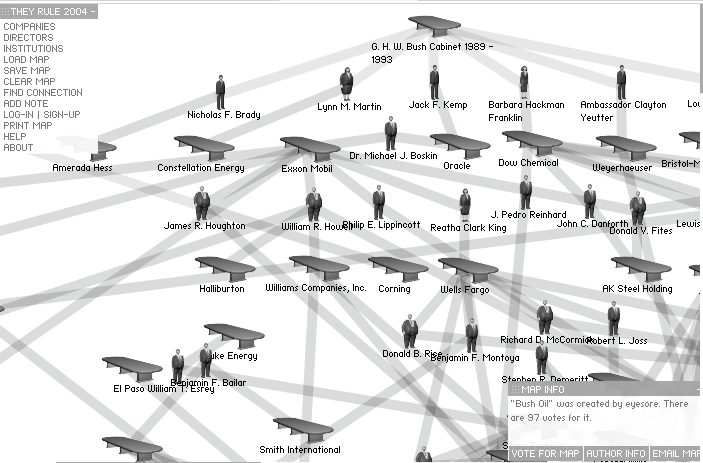
They Rule & Wikipedia
January 28th, 2008 by adminHere’s a way to get started with the idea.
First go to the site TheyRule.net and play with the system.
Select “Load Map”/”Popular” and pick an entry. You will see a network of connections appearing. The network shows the people that belong to different boards of companies. As you move your mouse over some of the entries you are given a menu to search or delete the item. Also very neat, you can ckick on an item and move it around with the mouse while retaining the existing connections.
I would like you to develop a program (web based) that would take data from a mysql database and display the graph of the relations existing between the data. TheyRule shows how somebody decided to do it (and very nicely at that), but other options exist.
The data I have is a huge collection of the edits that have been done to the english wikipedia pages. I have a database with 3 tables, and you can access them by going to this URL: http://cs.smith.edu/~thiebaut/wikihistory.
Click on the pages table. It contains the title of ALL the wikipedia pages and their Id, as generated by wikipedia.
Click on the contributors table. It contains the list of all the contributors who have edited a page in wikipedia. 3 different pieces of information can define a contributor: a name, an Id, or an IP address. Unfortunately, wikipedia doesn’t force contributors to enter their name (in fact, some contributors are computer programs, which do not have names, so contributors may or may not have any information recorded for up to two of these fields.
Click on the revisions table. It contains all the revisions performed. Each revision (or edit) is identified by an Id number (which I generate when populating this table), a revisionId which is the Id the revision has in the wikipedia database, the Id of the page on which this revision was done (pageId), the Id of the contributor (contributorId) who made the edit (this is the same contributor field used in the contributors table), a comment indicating what the edit was about, a textlength field which indicates how many characters were in the edit, and finally the date the edit was done.
I would like to be able to have a web page where I could enter the Id of a few pages (for example the pages corresponding to the current presidential candidates), and have a webpage showing the graph of all the contributors to the different pages, and whether a given contributor contributed to more than just one page. Similarly to the way “TheyRule” works.
A nice collection of software tools that should probably be used is the Graphviz set. Go take a look at it. It generates SVG graphs, and the major browsers have plugins to visualize SVG graphs.
Welcome
January 28th, 2008 by adminWelcome to DT’s Independent study blog.
This mediawiki page was generated by I love wiki, an HTML to wiki syntax converter that took the html version of the blog and translate it into wiki syntax
