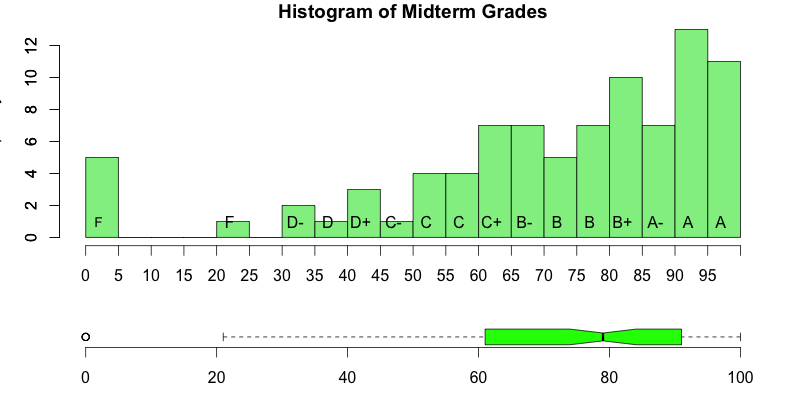
R Histogram & Boxplot of Grades
--D. Thiebaut (talk) 10:45, 22 March 2015 (EDT)
This is a simple recipe for generating a histogram and boxplot of student grades. For a much fancier solution, please see the R ProfessR package created and maintained by Prof. Jonathan M. Lees at UNC.
Data
The grades are saved in a txt file, 1 grade per line. Here's a typical list
R Script
# midtermGrades.R
# D. Thiebaut
############################################
# set working directory
setwd( "/Users/thiebaut/Desktop/Dropbox/111/" )

# read the grades, 1 per line, and make grades numeric
g <- read.table( "midtermGrades.txt" )
gg <- sapply( g, as.numeric)

# create a layout with boxplot at bottom
nf <- layout( mat = matrix(c(1,2),2,1, byrow=TRUE),  height = c(3,1))
# set parameters
par( mar=c(3.1, 3.1, 1.1, 2.1) )

# display histogram
hist <- hist( gg, main="Histogram of Midterm Grades", col="lightgreen", breaks=17, xaxt='n')
axis(2)
axis(side=1, at=seq( 20,100,5))
text( 22, 1, "E")
text( 32, 1, "D-" )
text( 37, 1, "D" )
text( 42, 1, "D+" )
text( 47, 1, "C-" )
text( 52, 1, "C" )
text( 57, 1, "C" )
text( 62, 1, "C+" )
text( 67, 1, "B-" )
text( 72, 1, "B" )
text( 77, 1, "B" )
text( 82, 1, "B+" )
text( 87, 1, "A-" )
text( 92, 1, "A" )
text( 97, 1, "A" )

# display boxplot
B <- boxplot( gg, horizontal=TRUE, outline=TRUE, frame=FALSE, col="green", notch=TRUE, width=40)
Output
