Tutorial: HeatMap Example
--D. Thiebaut (talk) 21:41, 23 July 2015 (EDT)
---
title: "Heat Map Example"
author: "Dominique"
date: "July 23, 2015"
output: html_document
---
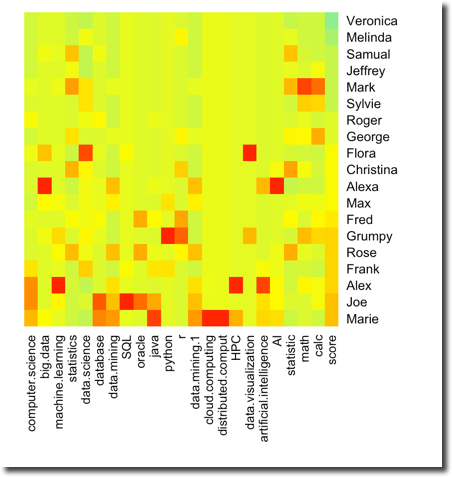
Method 1
```{r}
mm = read.csv( "info.csv" )
head( mm, 3 )
row.names( mm ) <- mm$name
mm <- mm[,2:ncol(mm)]
mm_matrix <- data.matrix( mm )
hmcols<-colorRampPalette(c("light green", "yellow", "orange", "red"))(100)

mm_heatmap <- heatmap( mm_matrix, Rowv=NA, Colv=NA,
                       col=hmcols,
                       scale="column",
                       margins=c(10,10) )

```

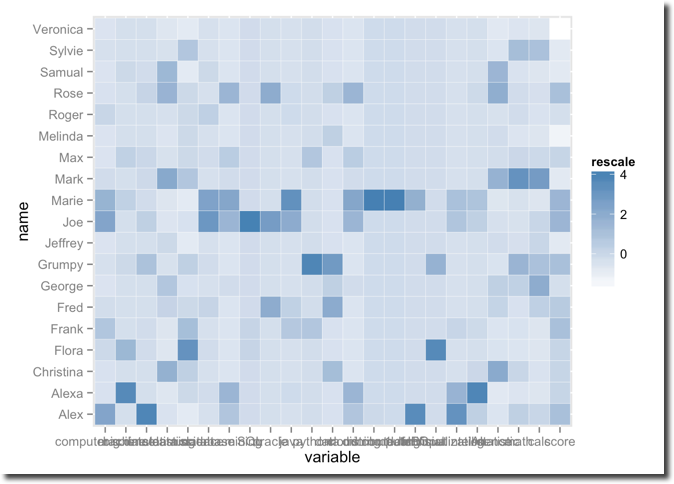
METHOD 2
- Generate a heatmap using ggplot
- Reference: https://learnr.wordpress.com/2010/01/26/ggplot2-quick-heatmap-plotting/
```{r}


#install.packages("ggplot2")
library(ggplot2)
#install.packages("reshape2")
library( reshape2 )
#install.packages("plyr")
library( plyr )
library("scales", lib.loc="/Library/Frameworks/R.framework/Versions/3.1/Resources/library")

mm <- read.csv( "info.csv")

mm <- mm[with(mm, order( score, name )),]
mm.m <- melt(mm)
mm.m <- ddply( mm.m, .(variable), transform, rescale = scale( value ) )

(p <- ggplot( mm.m, aes(variable, name))
      + geom_tile( aes( fill = rescale ),
                   colour="white")
                  + scale_fill_gradient( low="white", high="steelblue") )

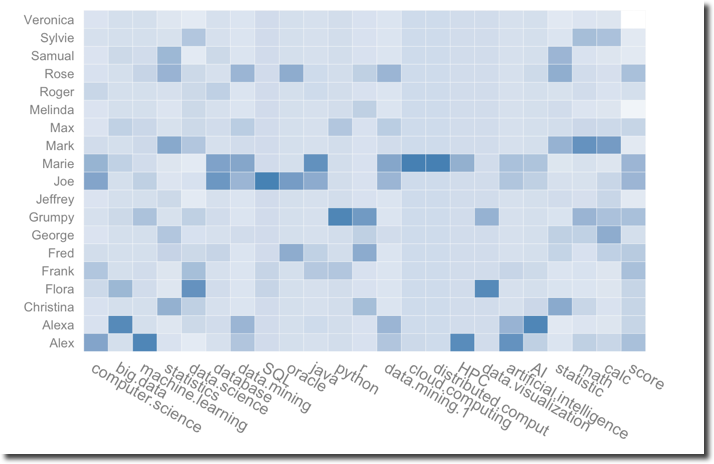
base_size <- 12

(p + theme_grey(base_size = base_size) + labs(x = "", y = "")
  + scale_x_discrete(expand = c(0, 0)) + scale_y_discrete(expand = c(0, 0))
  + theme(legend.position = "none", axis.ticks = element_blank(),
          axis.text.x = element_text(size = base_size * 1.0,
                                     angle = 330, hjust = 0,
                                     colour = "grey50")))
```
