Tutorial: HeatMap Example
--D. Thiebaut (talk) 21:41, 23 July 2015 (EDT)
Contents
This is more of a recipe than a tutorial. Something that can be useful for sorting out items with different qualities/properties.
Info.csv
The CSV file is generated by parsing documents and picking up keywords and accumulating the number of occurrences.
name, computer science, big data, machine learning, statistics, data science, database, data mining, SQL, oracle, java, python,  r , data mining, cloud computing, distributed comput, HPC, data visualization, artificial intelligence, AI, statistic, math, calc, score
Marie, 35, 2, 2, 5, 6, 17, 9, 0, 0, 17, 0, 0, 9, 46, 3, 7, 0, 9, 11, 12, 6, 0, 16
Joe, 45, 0, 7, 6, 7, 20, 7, 12, 4, 11, 0, 0, 7, 0, 1, 0, 0, 8, 6, 20, 6, 5, 16
Alex, 45, 0, 36, 8, 6, 1, 5, 0, 0, 0, 0, 0, 5, 1, 1, 13, 0, 23, 6, 14, 34, 5, 15
Frank, 21, 0, 2, 5, 11, 1, 1, 1, 0, 5, 1, 0, 1, 0, 1, 0, 0, 3, 2, 14, 4, 0, 15
Rose, 2, 0, 5, 58, 8, 1, 7, 0, 3, 1, 0, 1, 7, 0, 1, 0, 0, 0, 2, 92, 14, 2, 15
Grumpy, 3, 1, 12, 10, 9, 2, 1, 0, 0, 0, 4, 4, 1, 0, 1, 0, 1, 0, 0, 16, 78, 12, 15
Fred, 5, 0, 1, 24, 8, 4, 1, 0, 3, 3, 0, 3, 1, 0, 1, 0, 0, 0, 0, 39, 5, 7, 14
Max, 1, 2, 4, 10, 8, 2, 4, 0, 0, 0, 1, 0, 4, 0, 1, 0, 0, 0, 0, 24, 21, 4, 13
Alexa, 2, 13, 1, 4, 8, 2, 7, 0, 0, 1, 0, 0, 7, 0, 1, 0, 0, 13, 37, 8, 0, 0, 13
Christina, 2, 0, 1, 62, 9, 1, 1, 0, 0, 0, 0, 2, 1, 0, 1, 0, 0, 0, 3, 99, 23, 1, 13
Flora, 8, 6, 2, 4, 16, 2, 1, 1, 0, 0, 0, 0, 1, 0, 1, 0, 2, 0, 0, 16, 1, 0, 13
George, 1, 0, 1, 38, 7, 1, 2, 0, 0, 0, 0, 1, 2, 0, 1, 0, 0, 0, 0, 44, 32, 19, 12
Roger, 10, 0, 1, 11, 8, 5, 1, 0, 0, 1, 0, 0, 1, 0, 1, 0, 0, 0, 0, 19, 14, 1, 12
Sylvie, 3, 0, 1, 10, 10, 1, 1, 0, 0, 0, 0, 0, 1, 0, 1, 0, 0, 0, 0, 14, 64, 12, 11
Mark, 6, 0, 3, 71, 10, 1, 2, 0, 0, 0, 0, 0, 2, 0, 1, 0, 0, 0, 0, 86, 136, 25, 11
Jeffrey, 1, 0, 1, 19, 6, 1, 1, 0, 0, 0, 0, 0, 1, 0, 1, 0, 0, 0, 0, 25, 8, 5, 11
Samual, 1, 1, 2, 55, 6, 3, 1, 0, 0, 0, 0, 0, 1, 0, 1, 0, 0, 0, 0, 80, 3, 0, 11
Melinda, 1, 0, 1, 6, 8, 1, 1, 0, 0, 0, 0, 1, 1, 0, 1, 0, 0, 0, 0, 26, 0, 0, 10
Veronica, 1, 0, 1, 4, 6, 1, 1, 0, 0, 0, 0, 0, 1, 0, 1, 0, 0, 0, 0, 8, 0, 0, 9
R Markdown
---
title: "Heat Map Example"
author: "Dominique"
date: "July 23, 2015"
output: html_document
---
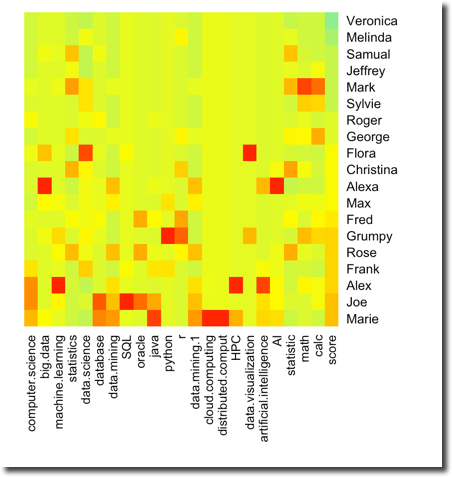
Method 1
```{r}
mm = read.csv( "info.csv" )
head( mm, 3 )
row.names( mm ) <- mm$name
mm <- mm[,2:ncol(mm)]
mm_matrix <- data.matrix( mm )
hmcols<-colorRampPalette(c("light green", "yellow", "orange", "red"))(100)

mm_heatmap <- heatmap( mm_matrix, Rowv=NA, Colv=NA,
                       col=hmcols,
                       scale="column",
                       margins=c(10,10) )

```

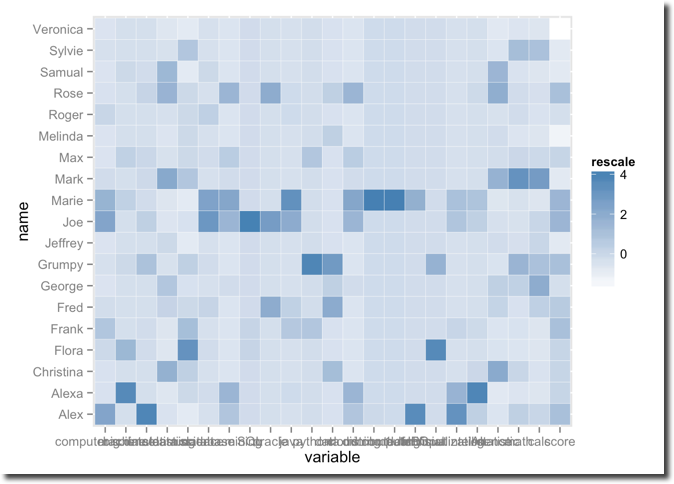
METHOD 2
- Generate a heatmap using ggplot
- Reference: https://learnr.wordpress.com/2010/01/26/ggplot2-quick-heatmap-plotting/
```{r}


#install.packages("ggplot2")
library(ggplot2)
#install.packages("reshape2")
library( reshape2 )
#install.packages("plyr")
library( plyr )
library("scales", lib.loc="/Library/Frameworks/R.framework/Versions/3.1/Resources/library")

mm <- read.csv( "info.csv")

mm <- mm[with(mm, order( score, name )),]
mm.m <- melt(mm)
mm.m <- ddply( mm.m, .(variable), transform, rescale = scale( value ) )

(p <- ggplot( mm.m, aes(variable, name))
      + geom_tile( aes( fill = rescale ),
                   colour="white")
                  + scale_fill_gradient( low="white", high="steelblue") )

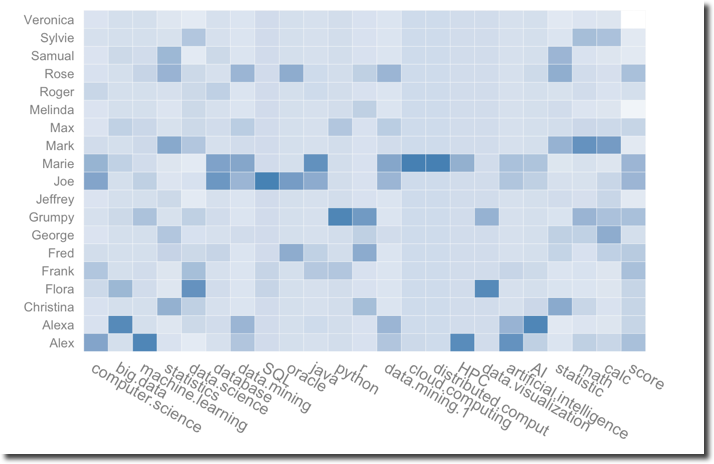
base_size <- 12

(p + theme_grey(base_size = base_size) + labs(x = "", y = "")
  + scale_x_discrete(expand = c(0, 0)) + scale_y_discrete(expand = c(0, 0))
  + theme(legend.position = "none", axis.ticks = element_blank(),
          axis.text.x = element_text(size = base_size * 1.0,
                                     angle = 330, hjust = 0,
                                     colour = "grey50")))
```
