Hadoop Tutorial 1.1 -- Generating Task Timelines
|
This Hadoop tutorial shows how to generate Task Timelines similar to the ones generated by Yahoo in their report on the TeraSort experiment. |
Introduction
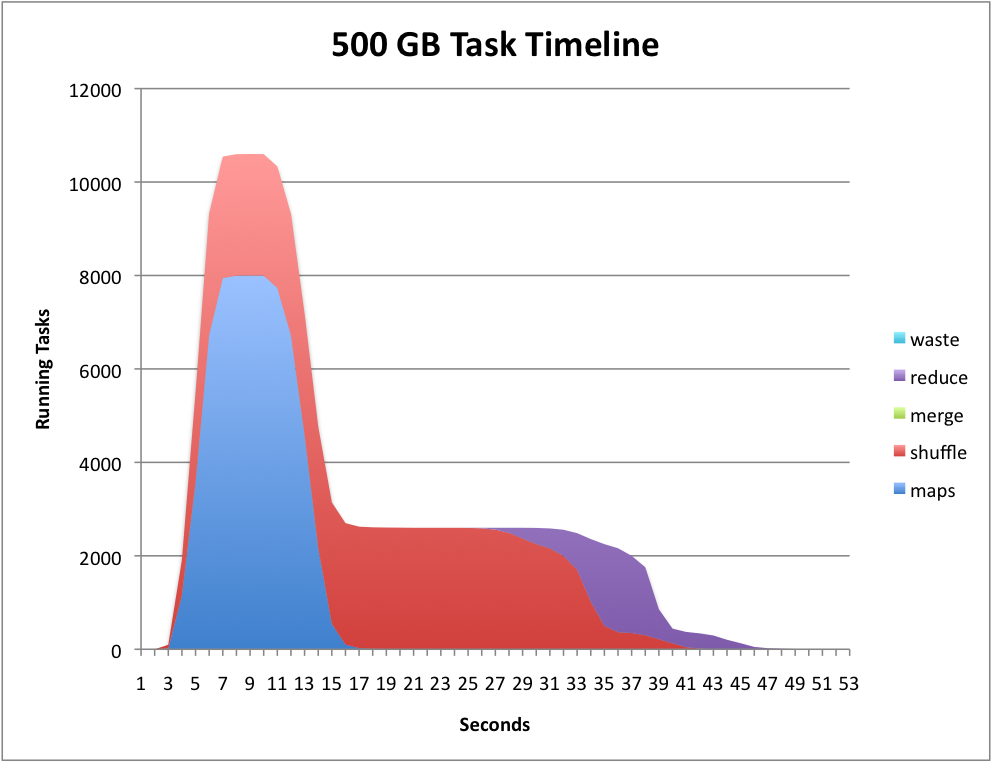
In May 2009 Yahoo announced it could sort a Petabyte of dat in 16.25 hours and a Terabyte of data in 62 seconds using Hadoop running on 3658 processors in the first case, and 1460 in the second case [1]. In their report they show very convincing diagrams showing the evolution of the computation as a time-line of map, shuffle, sort, and reduce tasks as a function of time, an example of which is shown below.

The graph is generated by parsing one of the many logs generated by hadoop when a job is running, and is due to one of the authors of the Yahoo report cited above. It's original name is job_history_summary.py, and is available from here. We have renamed it generateTimeLine.py.
Generating the Log
First run a MapReduce program. We'll use the WordCount program of Tutorial #1.
- Run the word count program on your input directory where you have one or more text files containing large documents.
hadoop jar /home/hadoop/352/dft/wordcount_counters/wordcount.jar org.myorg.WordCount dft6 dft6-output
- When the program is over, look for the most recent log file in the ~/hadoop/hadoop/logs/history directory:
 ls -ltr ~/hadoop/hadoop/logs/history/ | tail -1

 -rwxrwxrwx 1 hadoop hadoop 35578 2010-04-04 14:38 hadoop1_1270135155456_job_201004011119_0014_hadoop_wordcount
- This is the file we are interested in.
- Check that the script generateTimeLine.py is installed on your system:
which generateTimeLine.py (if you get response to the command, you have it!)
If the script hasn't been installed yet, create a file in your path that contains the Yahoo script for parsing the log file. The script is also available here.
- Feed the log file above to the script:
 cat hadoop1_1270135155456_job_201004011119_0014_hadoop_wordcount | generateTileLine.py
 time maps shuffle merge reduce
 0 1 0 0 0
 1 1 0 0 0
 2 1 0 0 0
 3 1 0 0 0
 4 0 1 0 0
 5 0 1 0 0
 ...
 294 1 0 0 0
 295 1 0 0 0
 296 1 0 0 0
 297 1 0 0 0
 298 1 0 0 0
 299 1 0 0 0
 300 1 0 0 0
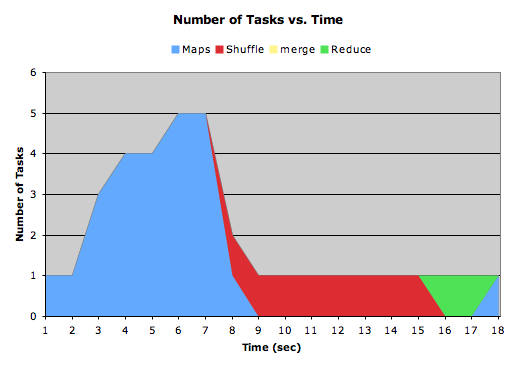
- Copy/Paste the output of the script into your favorite spreadsheet software and generate an Area graph for the data that you will have distributed in individual columns.
- You should obtain something like this:
References
- ↑ Owen O'Malley and Arun Murthy, Hadoop Sorts a Petabyte in 16.25 Hours and a Terabyte in 62 seconds, http://developer.yahoo.net/blogs, May 2009.
