CSC103 Processing Lab -- Part 1
--D. Thiebaut 20:23, 27 February 2012 (EST)
Revised --D. Thiebaut (talk) 10:49, 10 October 2017 (EDT)
This is Part 1 of a 2-part lab on the Processing language. You can find Part 2 here. Part 1 ends with a submission to Moodle. You will have until Saturday 10/14/17 noon to submit your solution.
Contents
Laptop Users: Download and Install Processing
- Go to http://processing.org/download/ and download the version for your system
- Install as you would a typical new application
Chromebook Users
- On your device, point your browser to Google Play app Generate: Processing Edition
- Install Generate: Processing Edition on your device
- It should be close to 100% compatible with what we do in class.
Explore The Repository of Examples
This section is to give you a sense of what Processing can do, and what Processing programs look like. (May or may not work on chromebook)
- Open the Processing app.
- Open the File menu
- Select the examples option
- Open the following applications (and others, if you wish to), and for each one click on the Run button (triangle button at top):
- Basics
- Image
- Pointillism
- Topics
- Drawing
- Continuous Lines
- Patterns
- Demos
- Graphics
- Particles
- Planets
Keep the Documentation Handy!
- Processing is a language that is well documented. All the functions that it supports are conveniently located in the Reference section of this URL: https://processing.org/reference/. Keep the Reference page open on your browser while programming. Most programmers do so when they code.
- Simple Rules to Remember:
- There is a semicolon at the end of each statement
- There must be a setup() and a draw() function in all sketches
- Statements are executed from top to bottom.
A First Example to Get the Idea
Assuming that you have Processing installed on your computer, type in the following code in the Integrated Development Environment (IDE):
void setup() {
  size(480, 480 );
  smooth();
}

void draw() {
  ellipse(mouseX, mouseY, 80, 80);
}
- Run your program.
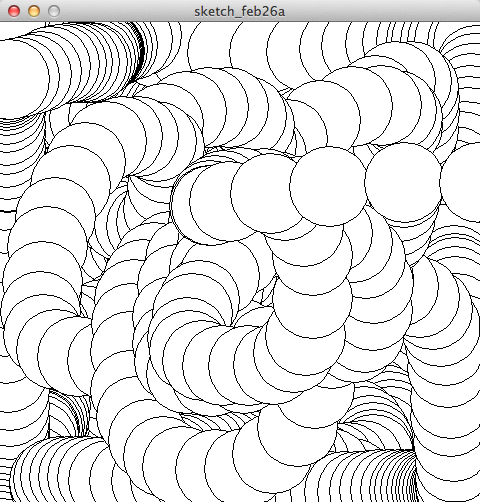
- Notice that the program draws circles (ellipses with the same horizontal radius as vertical radius) that overlap each other, following the mouse around.
- When the mouse is outside the window, the graphics window stops moving the circles. This is because the graphics window is sensitive to the mouse only when the mouse is over the window.
Some explanations
- Once again, a Processing program is called a sketch, and we'll use both terms here interchangeably.
- The sketch contains two functions: setup() and draw(). A sketch will always contain at least these two functions. They always need to be part of a sketch.
- Setup() is executed first and sets the size of the graphics window to 480 pixels wide by 480 pixels high. You can change these around to see how the new window is affected.
- smooth() is called by setup() to make the display of graphics shape smoother to the eye. This will slow down the program a tiny bit, but in most cases, this is something we'll want to do. You can try removing the smooth() call and see how it affect your program.
- The draw() function is listed next. This function is called 30 times a second, automatically. There is nothing to indicate that draw() is called regularly. It is part of the Processing machine. All it does is to draw an ellipse at the x and y location of the mouse on the graphics window. Top-left is 0, 0. Bottom right is 479, 479 (since our window size was set to 480, 480).
- And that's it!
This is our first example of animation with Processing. It's easy to do. Just make the draw() function draw something on the graphics window where the mouse is located, and do it 30 times a second. As the mouse moves, the new shapes are drawn following the mouse.
Some variations to try
Variation #1 |
- Locate the rect() graphics function in Processing's reference section.
- Notice how it should be used:
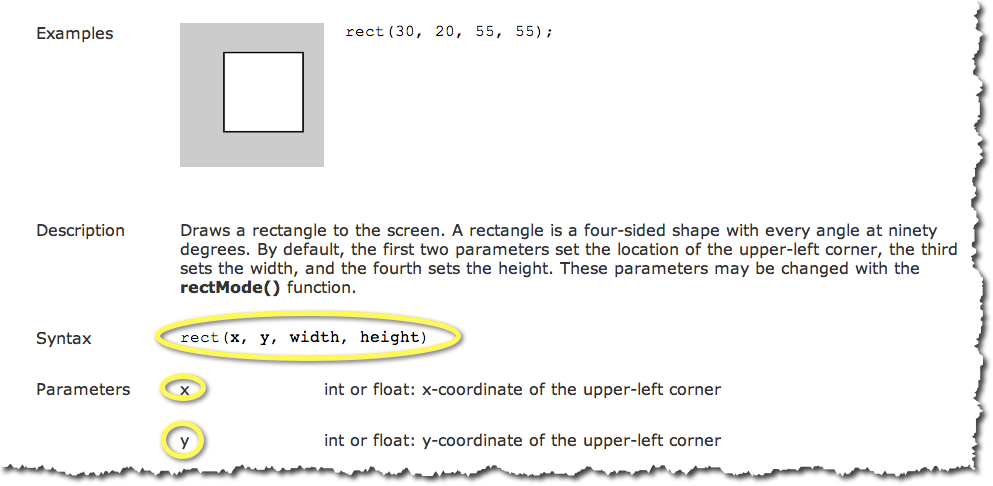
- Change the ellipse to a rectangle in the sketch as follows:
void setup() {
  size(480, 480 );
  smooth();
}

void draw() {
  // ellipse(mouseX, mouseY, 80, 80);
  rect( mouseX, mouseY, 80, 80 );
}
- the two slashes in front of the line with the ellipse() function transforms this line into a comment. A comment is a line of code that does not contain any code, and contains textual information that is skipped by the processor when it runs the program.
- The rect() function is asked to use mouseX, and mouseY as the coordinates of where to put the rectangle. The width and height of the rectangle are set to 80 pixels each.
- Play!
Variation #2 |
- Locate the background() graphics function in Processing's reference section.
- Read the description of the background() function.
- Add a call to the function background() in the draw() function. Pass it the value 200, which is light grey (you would use 0 for full black, and 255 for full white).
void setup() {
  size(480, 480 );
  smooth();
}

void draw() {
  background( 200 );
  // ellipse(mouseX, mouseY, 80, 80);
  rect( mouseX, mouseY, 80, 80 );
}
- Try the sketch.
- What is happening? Why is there only one rectangle on the screen?
- Comment out the rectangle function by putting two slashes in front of it, and uncomment the ellipse function by removing the two slashes that prefix it. Try the sketch again!
Variation #3 |
- Let's fill the ellipse with a color. This is accomplish with the fill() function.
- Find the description for fill() in the reference section of Processing.org (you know where to go, by now!)
- Add a call to fill() in the draw() function, before the call to ellipse.
void setup() {
  size(480, 480 );
  smooth();
}

void draw() {
  background( 200 );
  fill( 150 );
  ellipse(mouseX, mouseY, 80, 80);
  //rect( mouseX, mouseY, 80, 80 );
}
- Try the sketch!
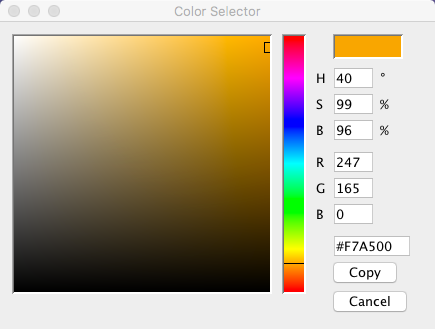
- If you want to change the color for something more appealing, try the Color Selector in the Tools menu:
- Move the slider in the rainbow bar, and then move the pointer in the square, and pick a color that you like. Then copy the three numbers in the R, G and B boxes, and include them in the fill() function, separated by commas. For example, assume you want to use an orange tint, with numbers R:247, G:165, B:0, then change the fill() function call to read:
- fill( 247, 165, 0 );
- Try it!
Variation #4 |
- Make your sketch display both a rectangle and a circle at the current mouse location.
- Hint #1: all you have to do is to call both the ellipse() and the rect() function in draw()!
- Hint #2: try calling ellipse first, then rect. See what that does. Then call rect first, before ellipse, and see how that changes things.
Variation #5 |
- Replace mouseY in the call to rect() by 100 (or some number of your choice between 0 and 500).
- Observe how your sketch now operates
Variation #6 |
- Change mouseX in the call to ellipse() to 100 (or some number of your choice between 0 and 500).
- Observe how your sketch now operates
Using Randomness
- Edit the call to the ellipse() function, and replace mouseX and mouseY by random(500):
ellipse( random( 500 ), random( 500 ), 80, 80 );
- this will make the x and y position of the ellipse random.
- Make sure there is no // symbols in front of the line containing the call to ellipse (otherwise it would be a comment).
- Run your sketch. Observe how the position of the circles is now fully random and independent of where the mouse pointer is.
Variation #1 |
- Instead of making the size of the circles constant with width 80 and height 80, make their sizes proportional to the X-location of the mouse on the sketch:
ellipse( random( 500 ), random( 500 ), mouseX, mouseX );
- this way the circles appear at random locations, but you can control how tall or flat they are by moving the mouse around.
Variation #2 |
- Make one of the components of the fill() function a random number between 0 and 255. For example:
fill( 100, 210, random( 255 ) );
- Observe how the colors of the circles now change slightly, while still remaining close.
- You can replace one or both of the another color components using the random( 255 ) function to get varying displays of color.
Challenge #1 |
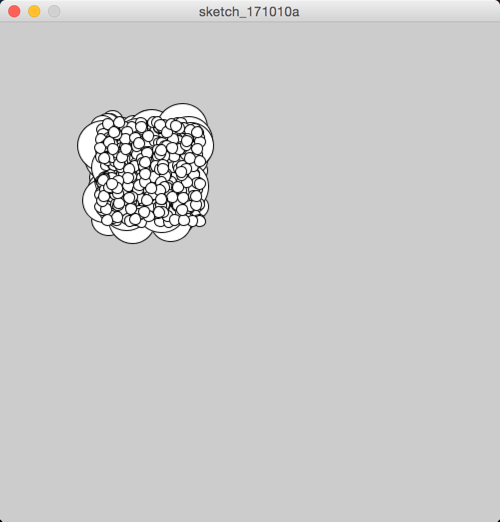
- Read the reference page on the random() function, and modify your sketch so that it outputs circles in a small square area of your sketch, as illustrated below. Your circles can be of any color you wish.
Challenge #2 |
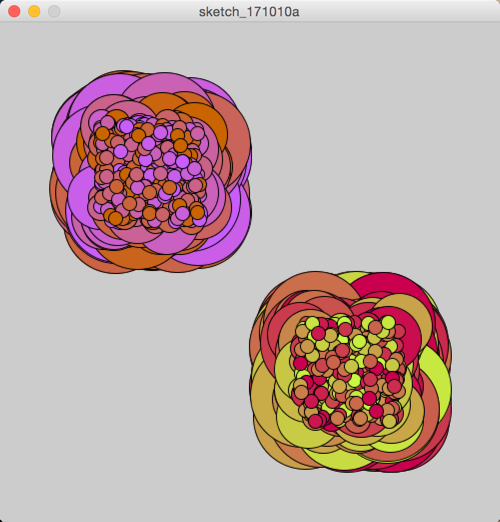
- Try to replicate the sketch below.
Displaying Text
- Read the page on the text() function in the reference section of processing.
- Recreate your earlier sketch that contains just a moving circle following the mouse.
- Add these four lines somewhere in the draw() function of your sketch:
  textSize( 32 );
  fill( 191, 44, 232 );
  text( "Processing is cool", 100, 100 );
  fill( 245, 243, 203 );
- Play with your sketch...
Variation #1 |
- Take the 4 lines above that you added to your draw() function, and move them to the end of the setup() function. Your sketch should now look like this:
// circles
// Your name

void setup() {
  size( 500, 500 );
  smooth();
  textSize( 32 );
  fill( 191, 44, 232 );
  text( "Processing is cool", 100, 100 );
  fill( 245, 243, 203 );
}

void draw() {
  ellipse( mouseX, mouseY, 80, 80 );
}
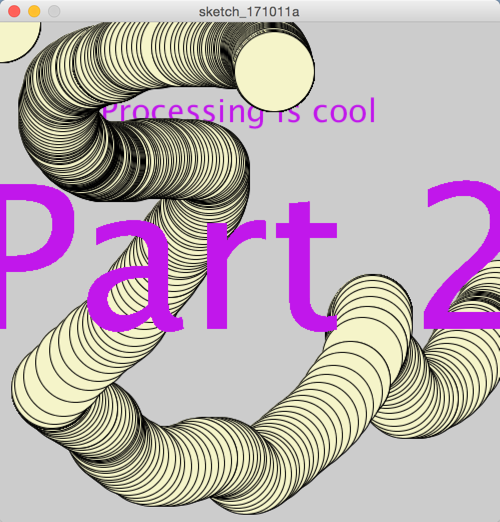
- Play with the sketch. Can you figure out why the text gets erased little by little?
Moodle Submission
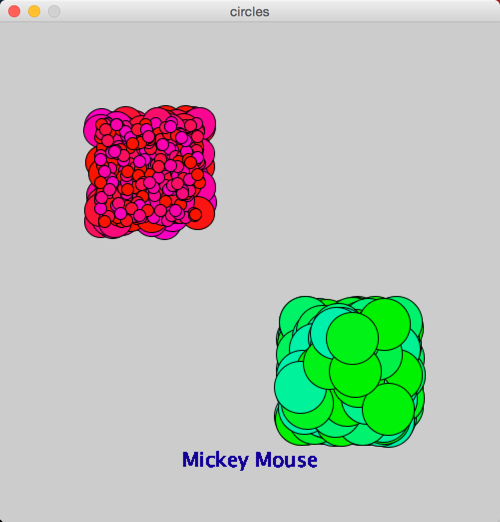
- Submit a screen capture of the graphic window emulating the image below, with two square areas covered by circles.
- Your graphic window should contain your name or names if you worked in pairs (See how I printed "Mickey Mouse" in the example below).
- You do not have to worry about matching the colors exactly. As long as the colors in the two different square areas are different enough, you are fine.
- Locate the "Processing Lab" section on Moodle, and submit a copy of your sketch output.
Solutions to Challenges
Solution sketches for all the challenges are available here.
Part 2
On Wednesday, next week, you will do Part 2 of this lab...
