CSC231 DDD Lab
--D. Thiebaut 09:35, 24 September 2012 (EDT)
<meta name="keywords" content="computer science, assembly language, pentium, exercise, machine language, intel" />
<meta name="description" content="Dominique Thiebaut's Web Page" />
<meta name="title" content="Dominique Thiebaut -- Computer Science" />
<meta name="abstract" content="Dominique Thiebaut's Computer Science Web pages" />
<meta name="author" content="thiebaut at cs.smith.edu" />
<meta name="distribution" content="Global" />
<meta name="revisit-after" content="10 days" />
<meta name="copyright" content="(c) D. Thiebaut 2000, 2001, 2002, 2003, 2004, 2005, 2006, 2007,2008" />
<meta name="robots" content="FOLLOW,INDEX" />
Contents
This tutorial will introduce you to the ddd debugger, and simple steps you can take to debug assembly programs.
Note: it seems that beowulf is not responding well with X11, so if you want to use the debugger, try grendel.csc.smith.edu, and you should have a friendlier server to deal with!
The Target Program
Create a simple program that adds the contents of two variables and stores the result in a third one.
The data section should be something like this:
a          dd          3
b          dd          5
result     dd          0
The code section, something like this:
          nop
          nop
          mov          eax, dword[a]
          add          eax, dword[b]
          mov          dword[result], eax
Save your program as simpleAdd.asm, and generate the executable as follows:
         nasm -f elf -F stabs simpleAdd.asm
         ld -melf_i386  -o simpleAdd simpleAdd.o
Test
Run your program.
What happens?
Why?
The Debugger
Start the Debugger
Start the debugger and instruct it to open the program simpleAdd
ddd simpleAdd &
Configuration
You need to do this step only once, the very first time you use the debugger.
Before we can start using DDD, we need to change some of its default settings.
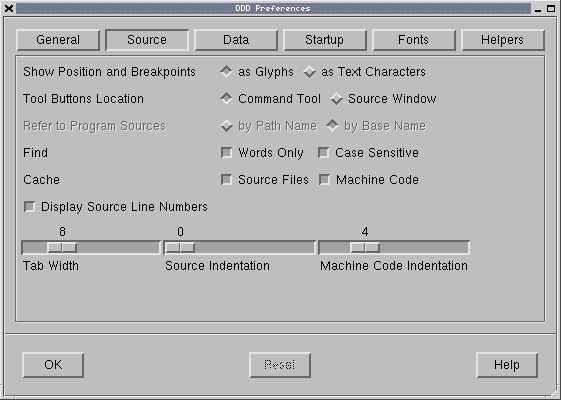
Select "Edit->Preferences" from the main menu. On the window that will appear, open the "Source" tab (top of the window). Then, check the "Display Source Line Numbers" option. Click OK to close the window.
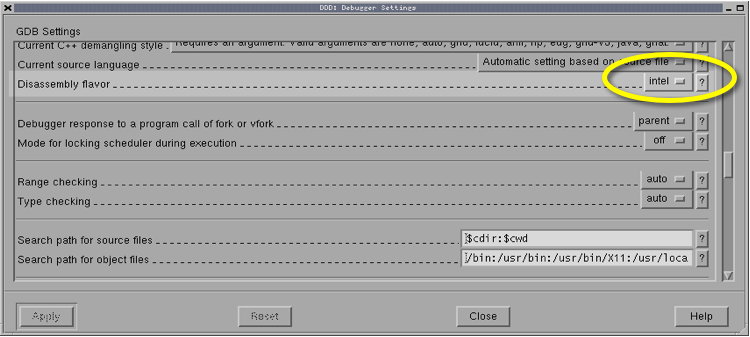
Next, select "Edit->GDB Settings" from the main menu. In the window that pops up, scroll approximately half way down through the list of options, until you find the option "Disassembly flavor". Change its value to "Intel" (Figure 3.2) and click on CLOSE.
Running the Debugger
Just follow the same steps we did in class to execute your program one step at a time, and to verify that the number 8 ends up in the variable result.
- Click on Status, Registers to see the register window
- Set a breakpoint on the second NOP instruction by clicking right on the instruction
- Display the 3 variables: Data, then Memory, then select to display 1 hex double-word at location &a. Same thing for b and result.
- Run the program by clicking Run in the tall grey window pane. The debugger will execute the first NOP and stop on the second one.
- Single step the program with Stepi.
Exercise 1
Edit your program so that now it computes the sum of 5 variables, a, b, c, d, and e, and saves the sum in result.
Single step your program and verify that it generates the correct answer.
Exercise 2
Modify your program one more time and make the data section equal to this definition:
Fib dd 1, 1, 0, 0, 0, 0, 0
And modify the code so that your program will store the sum of the first two double-words into the third double-word, the sum of the second and third double-word in the fourth, and so on. This way your program will compute the first 7 terms of the Fibonacci sequence.
Debug your program and show your instructor that you end up with 1, 1, 2, 3, 5, 8, 13 in memory.

