Tutorial: Shiny Application to Visualize Data Generated On-the-Fly
--D. Thiebaut (talk) 08:31, 18 July 2015 (EDT)
|
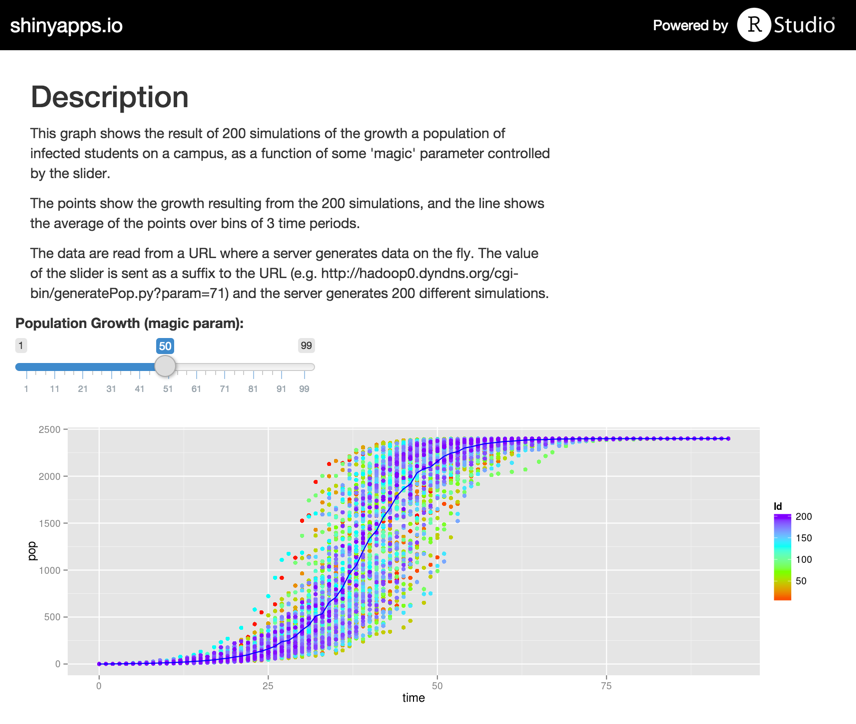
This tutorial deals with visualizing data in R. It illustrates one way (there are others, probably simpler, faster, and more efficient) to get data generated on the fly on a server, and to display them them in a Shiny application. When the user activates one of the input widgets in Shiny, an HTTP request is sent to a server, and the value of the parameter defined by the widget is sent along. A python script in the cgi-bin directory on the server gets activated, generates new data, ajd sends them back to the Shiny App as straight text. The Shiny App then displays the data. You can try the resulting app here. |
Other tutorials on R and various technologies can be found here.
Video Demo
Full Markdown
The raw, full markdown resulting from the CVC workshop is available here. Use for background information.
Shiny App
Python CGI script
This script is written in Python V.3. It must reside in a cgi-bin directory on a server you have access to, and on which the Apache server has been configured to allow CGI scripts.
The reason I use a cgi-bin solution is that the computational load for generating the data can be quite high, and using cgi allows me to put the computation on any server that has enough CPU power and memory storage, including AWS clusters.
dominique@hadoop0:~/R$ cat /usr/lib/cgi-bin/generatePop.py
#! /usr/bin/env python3
# generatePop.py
# D. Thiebaut
# CGI script that lives in /usr/lib/cgi-bin on remote server.
#

import random, sys
import cgi

print( "Content-Type: text/plain" )
print()

# define parameters
dataFileName = "pop%02d_%04d.dat"
maxT         = 2          # how fast we progress in time
T            = 3 * 31     # max time frame (3 months)
maxPop       = 2400       # max # of students
proportion   = 0.50       # how much of the population contributes
                          # to new cases of infection
noSimulations= 200
oneBigFile   = True
severalFiles = False
printOut     = True
dico         = {}

def getParams():
    dico = {}
    arguments = cgi.FieldStorage()
    for i in arguments.keys():
        #print( i, "-->", arguments[i].value )
        dico[i] = arguments[i].value
    return dico

def getProportion( dico ):
    if "param" in dico:
        prop = int(dico["param"])/100.0
    elif "proportion" in dico:
        prop = int(dico["proportion"])/100.0
    else:
        prop = 0.50

    return prop

def getNoSimulations( dico ):

    if "simulations" in dico:
        noSim = int( dico["simulations"])
    else:
        noSim = 200
    return noSim

def generateOneInfectionHistory( Id ):
    global dataFileName

    # iterate and generate population
    pop = 0             # starting pop
    t = 0
    out = ""
    while t <= T:
        out += "%d, %d, %d\n" % ( Id, t, pop )
        if pop < maxPop / 2:
            pop += 1 + random.randrange( int( pop*proportion) +1 )
        else:
            pop += 1 + random.randrange( int( (maxPop - pop)*proportion) + 1 )
        pop = min( maxPop, pop )
        t += 1 + random.randrange( maxT )
    return out


def main():
    global noSimulations, proportion

    # get the parameters from the URL
    dico = getParams()

    # get proportion parameter from URL
    proportion = getProportion( dico )
    noSimulations = getNoSimulations( dico )

    #print( "proportion = ", proportion )
    #print( "simulations = ", noSimulations )
    #return

    allOut = "Id, time, pop\n"
    if printOut:
        print( allOut, end="" )

    for i in range( noSimulations ):
        out = generateOneInfectionHistory( i+1 )
        if printOut:
            print( out, end="" )

        allOut += out
        if severalFiles:
            out = "Id, time, pop\n" + out
            open( "pop%02d_%04d.dat" % (int(proportion*100),i+1), 'w' ).write( out )
            #print( dataFileName % (int(proportion*100), i+1), "created" )

    if oneBigFile:
        open( "pop%02d_%04d_%04d.dat" % (int(proportion*100),0,(i+1)), 'w' ).write( allOut )


main()
- The current location for this script is http://hadoop0.dyndns.org/cgi-bin/generatePop.py?param=70. The parameter value is passed at the end of the URL. The output generated by accessing this URL is shown below:
Id, time, pop
1, 0, 0
1, 2, 1
1, 4, 2
1, 5, 4
1, 7, 7
1, 8, 11
1, 10, 17
1, 12, 20
1, 14, 29
1, 16, 38
...
Shiny App
# app.R
# D. Thiebaut
# reads data from files on a Web server using cgi-bin
# uses a slider
library( "ggplot2" )
library( "shiny" )

# ===================================================
#                                                 S E R V E R
# ===================================================
server <- function( input, output ) {

  dataSet <- reactive( {
    fileName <- paste0( "http://hadoop0.dyndns.org/cgi-bin/generatePop.py?proportion=", input$n_breaks,
                        "&simulations=", input$noSimulations )
    read.csv( url( fileName ) )
  } )

  output$main_plot <- renderPlot({
    ggplot( data=dataSet(),
            aes( x = time, y = pop, color = Id ) ) +
      geom_point( ) +
      scale_colour_gradientn(colours=rainbow(4)) +
      stat_summary(fun.y = mean, geom = 'line', color = 'blue' )
  } )
}

# ===================================================
#                                                          U I
# ===================================================

ui <- fluidPage(

  #---  TITLE  ---
  titlePanel( "Infected Population", windowTitle = "Growth of Infected Population" ),

  #---  MAIN PANEL ---
  mainPanel( h2( "Description"), p( "This graph shows the result of 200 simulations of the growth a population of infected students on a campus, as a function of some 'magic' parameter controlled by the slider."),
             p( "The points show the growth resulting from the 200 simulations, and the line shows the average of the points over bins of 3 time periods." ),
             p( "The data are read from a URL where a server generates data on the fly.  The value of the slider is sent as a suffix to the URL (e.g. http://hadoop0.dyndns.org/cgi-bin/generatePop.py?param=71) and the server generates 200 different simulations." )

  ),

  #--- INPUT BOX ---
  selectInput(inputId = "noSimulations",
              label = "Number of Simulations:",
              choices = c(20, 100, 250, 500, 1000),
              selected = 250),

  #--- SLIDER ---
  sliderInput( inputId = "n_breaks", label = "Population Growth (magic param):",
               min = 1, max = 99, step = 0.5, value = 50 ),

  plotOutput(outputId = "main_plot", height = "300px")
)

shinyApp(ui = ui, server = server)
Output
- This Shiny App has been published to shinyapps.io, and is available here.
- A static version of the app is shown below:

Getting the Data Using the RCurl Package
Rather than pasting the URL that gets the data from the CGI script, we can use the RCurl package, and get cleaner code, with the same behavior.
# app.R
# D. Thiebaut
# reads data from files on a Web server using cgi-bin
# uses a slider
library( "ggplot2" )
library( "shiny" )
library( "RCurl")

server <- function( input, output ) {
  dataSet <- reactive( {
      URL <-  "http://hadoop0.dyndns.org/cgi-bin/generatePop.py"
      tt <- getForm( URL, param = toString(input$n_breaks), simulations = toString(input$noSimulations ) )
      read.csv( textConnection( tt ) )
  } )

  output$main_plot <- renderPlot({
    ggplot( data=dataSet(),
            aes( x = time, y = pop, color = Id ) ) +
      geom_point( ) +
      scale_colour_gradientn(colours=rainbow(4)) +
      stat_summary(fun.y = mean, geom = 'line', color = 'blue' )
  } )
}

ui <- fluidPage(

  titlePanel( "Infected Population", windowTitle = "Growth of Infected Population" ),

  mainPanel( h2( "Description"), p( "This graph shows the result of 200 simulations of the growth a population of infected students on a campus, as a function of some 'magic' parameter controlled by the slider."),
             p( "The points show the growth resulting from the 200 simulations, and the line shows the average of the points over bins of 3 time periods." ),
             p( "The data are read from a URL where a server generates data on the fly.  The value of the slider is sent as a suffix to the URL (e.g. http://hadoop0.dyndns.org/cgi-bin/generatePop.py?param=71) and the server generates 200 different simulations." )

  ),
  selectInput(inputId = "noSimulations",
              label = "Number of Simulations:",
              choices = c(20, 100, 250, 500, 1000),
              selected = 250),

  sliderInput( inputId = "n_breaks", label = "Population Growth (magic param):",
               min = 1, max = 99, step = 0.5, value = 50 ),

  plotOutput(outputId = "main_plot", height = "300px")
)

shinyApp(ui = ui, server = server)
Food for Thought
- The RCurl package supports ssh and scp, which makes it possible to directly copy data from a remote server, and run an application on the remote server, without it having to be a CGI script.
- See http://stackoverflow.com/ for some ideas on how to do this...
Publishing the Shiny App on Smith's Shiny Server
- ssh to studio.smith.edu with your Smith credentials
- Pick a name for your Shiny app. I've chosen dft_app1. This will be part of the URL of the shiny app, once uploaded to the Shiny server.
- Enter the following commands at the Linux prompt:
mkdir /srv/shiny-server/dft_app1
cd  /srv/shiny-server/dft_app1
emacs -nw server.R
- Enter the following code in the file server.R:
library(shiny)
library( "ggplot2" )

# Define server logic required to draw a histogram
shinyServer(
  function( input, output ) {

  dataSet <- reactive( {
    fileName <- paste0( "http://hadoop0.dyndns.org/cgi-bin/generatePop.py?proportion=", input$n_breaks,
                        "&simulations=", input$noSimulations )
    read.csv( url( fileName ) )
  } )

  output$main_plot <- renderPlot({
    ggplot( data=dataSet(),
            aes( x = time, y = pop, color = Id ) ) +
      geom_point( ) +
      scale_colour_gradientn(colours=rainbow(4)) +
      stat_summary(fun.y = mean, geom = 'line', color = 'blue' )
  } )
} )
- Save the file you just created, and create a new one:
emacs -nw ui.R
- Enter the following code:
library( "shiny" )

shinyUI( fluidPage(

  #---  TITLE  ---
  #runtime: shiny
  #---
  mainPanel( h2( "Description"), p( "This graph shows the result of 200 simulations of the growth a population of infected students on a campus, as a function of some 'magic' parameter controlled by the slider."),
             p( "The points show the growth resulting from the 200 simulations, and the line shows the average of the points over bins of 3 time periods." ),
             p( "The data are read from a URL where a server generates data on the fly.  The value of the slider is sent as a suffix to the URL (e.g. http://hadoop0.dyndns.org/cgi-bin/generatePop.py?param=71) and the server generates 200 different simulations." )

  ),

  #--- INPUT BOX ---
  selectInput(inputId = "noSimulations",
              label = "Number of Simulations:",
              choices = c(20, 100, 250, 500, 1000),
              selected = 250),

  #--- SLIDER ---
  sliderInput( inputId = "n_breaks", label = "Population Growth (magic param):",
               min = 1, max = 99, step = 0.5, value = 50 ),

  plotOutput(outputId = "main_plot", height = "300px")
)
)
- Save the file. One more command to make the files readable by all:
chmod a+r *
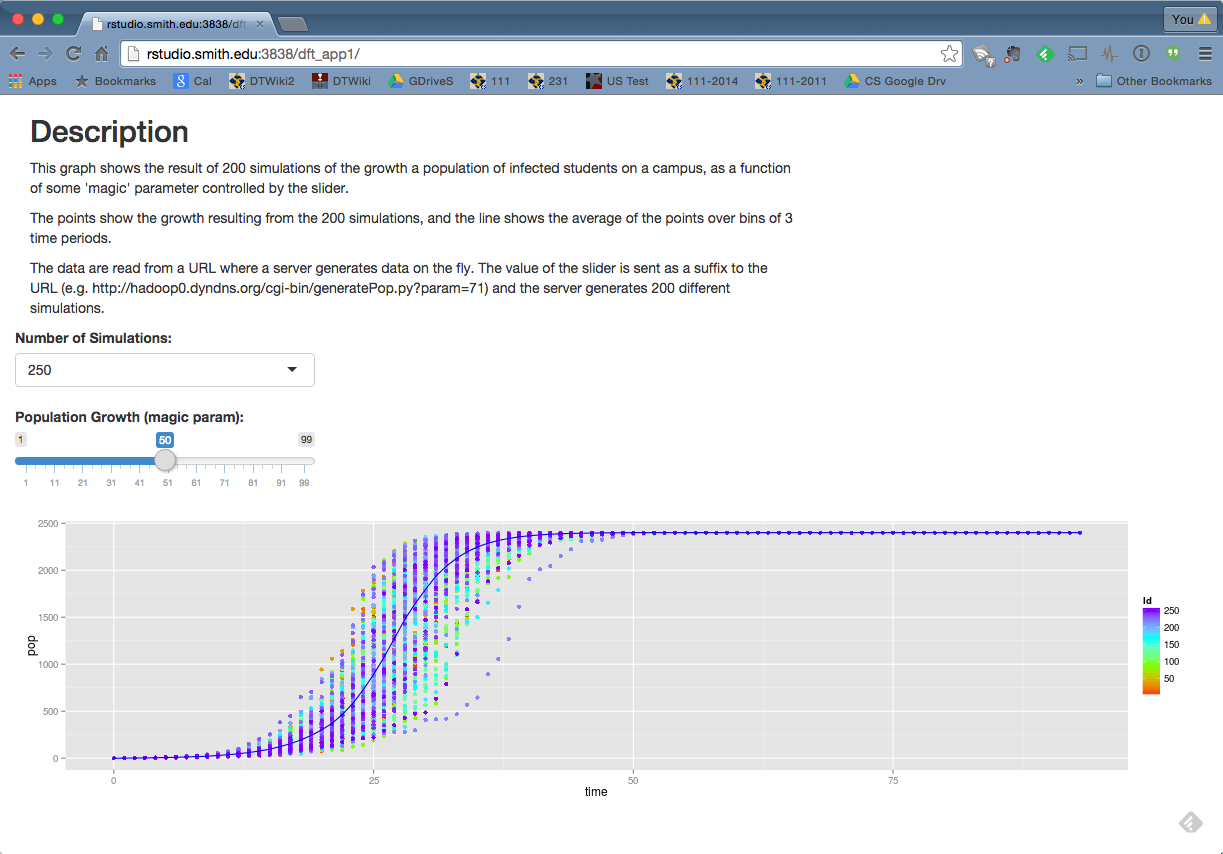
- Point your browser to this URL: http://rstudio.smith.edu:3838/dft_app1/ (dft_app1 is the folder that was created with the mkdir command, above).
- You should see the Shiny app:
